A Google Ads audit is a structured review of a live account that answers one question: which dollars are producing customers and which are not. Done properly it takes two to four hours for a mid-sized account, follows a fixed order, and ends with a ranked action plan rather than a list of observations. This checklist covers the 12 checks that matter in 2026, the sequence to run them in, and how to tell a real finding from cosmetic noise.
It is written for founders, marketing leads, and in-house buyers who own a Google Ads account and suspect money is leaking out of it. The uncomfortable part comes first: most accounts are right to suspect that.
What a Google Ads audit is, and what it is not
An audit inspects the account against the business outcome it is supposed to produce. That is a different exercise from an automated score. Graders and audit tool reports check settings against generic best practices and hand back a number. Useful as a smoke alarm, thin as a diagnosis, because no single metric and no tool knows what a qualified lead is worth to you.
A PPC audit is the same discipline applied across every paid search account you run, so if Microsoft Ads sits alongside Google, audit both in the same pass. The mechanics below transfer almost unchanged.
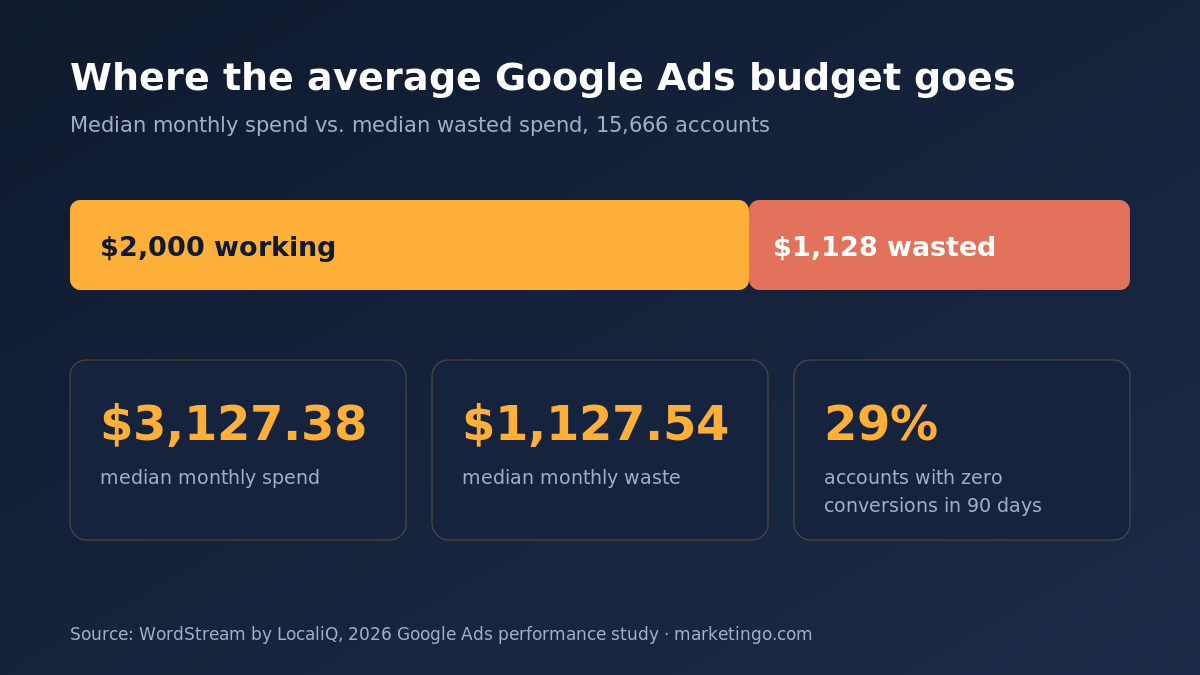
The scale of the problem is well documented. Across 251,236 reports from 15,666 Google Ads accounts, WordStream found the average account wastes $1,127.54 per month against an average monthly spend of $3,127.38 (WordStream by LocaliQ, 2026 performance study). That is roughly 36 cents of every dollar going to clicks that never convert. The same study found 29% of accounts recorded zero conversions across a 90-day period, and that accounts with zero conversions still averaged 12,667 impressions a month. Even among advertisers spending over $10K a month, 4% produced nothing at all.
Those numbers are the reason a real Google Ads audit starts with measurement rather than with keywords. An account can look immaculate and still be wasting money every day, because a tidy interface says nothing about whether the conversions being counted are real.
Before you open the account: three numbers to have ready
Pull these first, because every judgement below depends on them.
A 90-day window. Thirty days is too short to separate signal from seasonality in most accounts, and 12 months buries recent changes. Ninety days is the working default, with a year-over-year comparison alongside it so you are reading historical performance rather than one noisy quarter.
Your real target. Not the platform's target, yours. For lead generation that is a maximum cost per lead that still clears margin after your close rate. For eCommerce it is a break-even ROAS derived from contribution margin. Our lead generation ROI calculator and eCommerce ROAS calculator will get you both in a couple of minutes.
The brand and non-brand split. Almost every account looks profitable until you separate the two. More on this at check 2, because it changes how you read everything else.
The 12-point Google Ads audit checklist
Run these in order across all of your Google Ads campaigns. The sequence matters more than most people expect, because fixing bids in an account with broken tracking means you optimize toward a number that was never true.
1. Conversion tracking integrity
Start here and be ruthless. Confirm each conversion action's category, counting setting, attribution model, and lookback window. Check whether "Include in Conversions" is on for the actions you actually bid toward and off for soft signals like page views and newsletter sign-ups. Cross-check the last 30 days of Google Ads conversions against your CRM or back office; a variance beyond roughly 10% needs an explanation before you continue.
Then check for duplication. A conversion tracking code fired twice, a thank-you page counted alongside a form submit event, and imported Google Analytics 4 goals stacked on top of native tags all inflate the same conversion two or three times. An account bidding on inflated data will spend confidently into the wrong queries. Verify enhanced conversions and consent settings are live too, because in 2026 an account without them is handing the bidding algorithm a partial picture of its own results.
2. Brand versus non-brand
Split the account by brand and non-brand and rebuild the headline numbers for each. Brand campaigns typically post cheap clicks and high conversion rates because those buyers were already looking for you. Blended into one total, they flatter the account and hide the fact that acquisition is underperforming.
If non-brand cannot hit target on its own, no bid adjustment fixes that. It is a targeting, offer, or landing page problem. This single split changes more audit conclusions than any other check on the list.
3. The search terms report
Sort search terms by cost, descending, over the 90-day window, then filter for zero conversions. The top 20 rows in that view usually explain a large share of the waste. You are looking for three patterns: informational queries where the searcher wanted an answer and not a vendor, job seekers and students, and near-miss product terms for things you do not sell.
For a client selling into a large product catalogue, this check is where the money hides. On a roughly 40,000-SKU BigCommerce store we audited, 37% of budget was going to products that had generated zero revenue. Cutting that waste and redeploying it lifted blended Google ROAS from 7.86 to about 8.5 while total spend went up, not down.
4. Negative keyword coverage
Check negatives at all three levels: account lists, campaign, and ad group. Confirm the lists are actually applied, since orphaned shared lists that were built and never attached are common. Look at match types on negatives too, because a phrase-match negative will not block every variant you assumed it would.
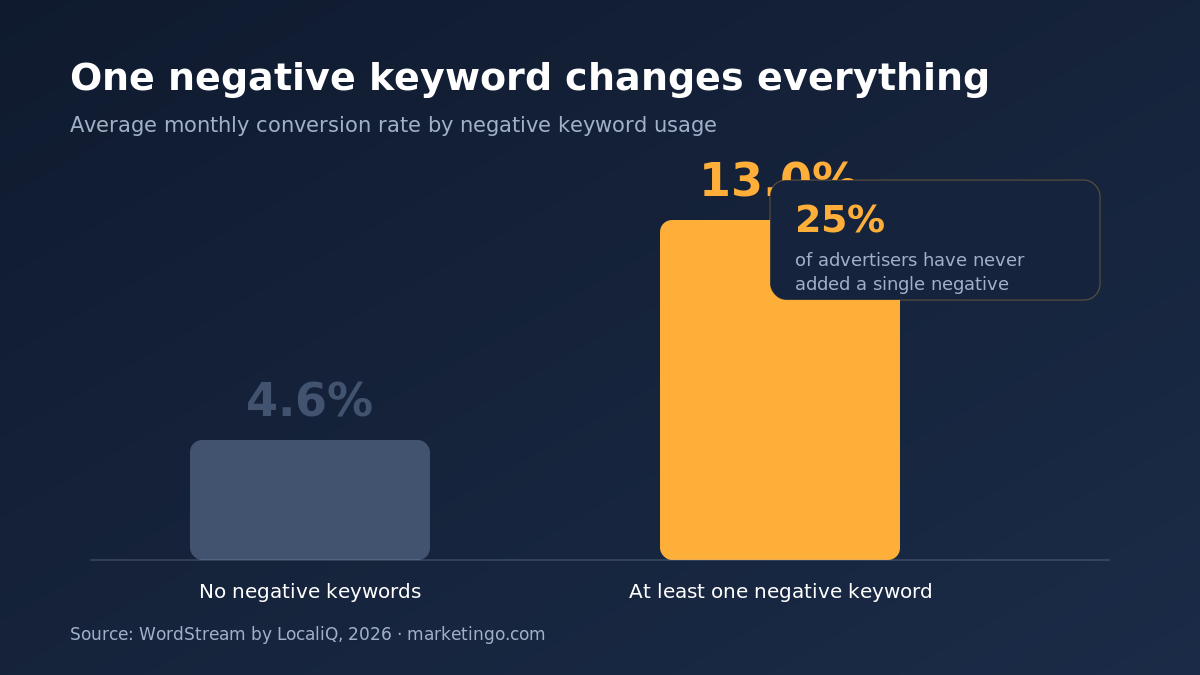
The payoff here is unusually well evidenced. Accounts with at least one negative keyword average a 13% monthly conversion rate versus 4.6% for accounts with none, close to a 3x difference, and 25% of businesses have never added a single one (WordStream by LocaliQ, 2026). If you find an empty negative list, you have already found the highest-return fix in the account.
5. Keywords and match types
Review the keyword table for three things. First, duplicates competing across ad groups and campaigns, which fragment data and drive up cost per click. Second, the match type mix, and specifically whether broad match is running under a bidding strategy and conversion volume that can actually steer it. Broad match with strong conversion data and tight negatives works well; broad match on a thin account is an expensive experiment.
Third, look at what is carrying spend versus what is carrying conversions. Long-tail keywords with lower volume and clearer user intent frequently outperform the expensive head terms that soak up the budget. Pause or bid down any poorly converting keyword that has spent more than three times your target cost per conversion without producing one.
6. Account structure
High-performing accounts are more granular. Accounts graded as top performers averaged two to three times more ad groups than low-scoring ones, and ran more campaigns split by goal, location, or service line (WordStream by LocaliQ, 2026). The mechanism is not mysterious: tighter themes mean the keyword, the ad, and the landing page all say the same thing, which lifts relevance and Quality Score.
So check whether each ad group holds a single tight theme rather than 100 mixed terms, and whether campaign settings segment by anything that deserves a separate budget. Average Quality Score across graded accounts sits between 5 and 6, and only 22% of accounts reach 7 or above, so there is usually room here.
7. Bidding strategy versus data volume
Match the strategy to the evidence available. Target CPA and target ROAS need consistent conversion volume to work, commonly cited as roughly 30 conversions in 30 days for the campaign. Below that, smart bidding is guessing with your money, and Maximize Conversions with a sensible bid ceiling is usually the safer setting until volume builds.
Check when targets were last changed and by how much. Large target swings restart the learning period and reset performance, which shows up as a repeating sawtooth in the daily data. Also check for a bidding strategy optimizing toward a conversion action you flagged as questionable in check 1.
8. Budget and impression share
Look at where the money actually goes versus where the conversions come from. Then read lost impression share, split by budget and by rank. Lost share to budget on a campaign that hits target is the clearest scale opportunity in any account. Lost share to rank on a campaign missing target is a relevance or bid problem, and adding budget will make it worse.
Watch for the pattern where one campaign quietly consumes half the account. It is remarkably common and rarely deliberate.
9. Ad copy and assets
Check that every ad group has at least one responsive search ad with a full complement of headlines and descriptions, and that asset performance ratings are not sitting at "Low". Confirm sitelinks, callouts, structured snippets, and images are present at the right level, since missing assets cost visibility with no offsetting saving.
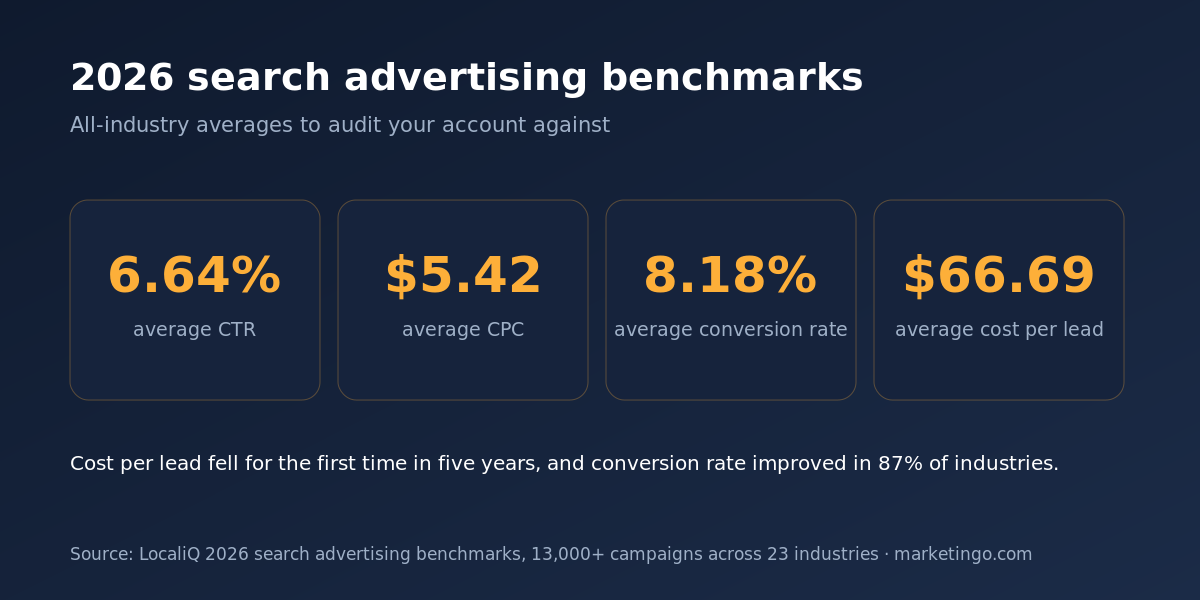
Ad copy is a bigger lever than its reputation suggests. On a document redaction software account, rewriting the ads against the actual buyer objection moved Search click-through rate from about 1% to 4-5%, and cost per trial fell from $64 to $27 as trial signups roughly tripled. The average CTR across paid search in 2026 is 6.64%, so an ad group sitting well below that number has a copy problem rather than a bidding one (LocaliQ, 2026 search advertising benchmarks).
10. Performance Max and AI Max exposure
This is the check that changed most in 2026. For any Performance Max campaign, review the channel breakdown, the asset group themes, and whether account-level brand exclusions are configured. PMax without brand exclusions will absorb your own brand traffic and report a ROAS that belongs to demand you already had.
Then check your AI Max exposure. AI Max for Search reached general availability in April 2026, and from September 2026 campaigns using automatically created assets together with the campaign-level broad match setting are auto-upgraded to it (Google Ads, 2026). If nobody on your side has made a decision about that, the decision is being made for you next month. The controls that matter are search term controls, brand controls, location of interest settings, and final URL expansion, and each should be a deliberate choice.
11. Landing pages and the post-click gap
Follow the click. Check that each ad group points at a page matching its promise, that the page loads fast on mobile, and that the primary action is visible without scrolling. Then compare conversion rate by landing page against the 2026 search average of 8.18%. A page well under that with healthy traffic is where the audit findings stop being about Google Ads.
Confirm the form itself works, on mobile, from a real device. Broken forms are the single most expensive fault an audit can find, and they hide easily behind a healthy-looking click-through rate.
12. Targeting: geography, audiences, and networks
Finish with the targeting settings that quietly widen reach. Check location targeting is set to presence rather than presence-or-interest unless you deliberately want the wider net. Confirm the Search Partners and Display Network settings on search campaigns are intentional, since both send paid search traffic you may never have asked for. Review audience segments applied in observation versus targeting mode, and check ad schedule and device performance for obvious drains.
These are small checks individually. Together they routinely account for a tenth of the spend in accounts that have never been reviewed.
What to fix first
An audit that produces 40 findings and no ranking is a report, not an action plan. Order the work like this.
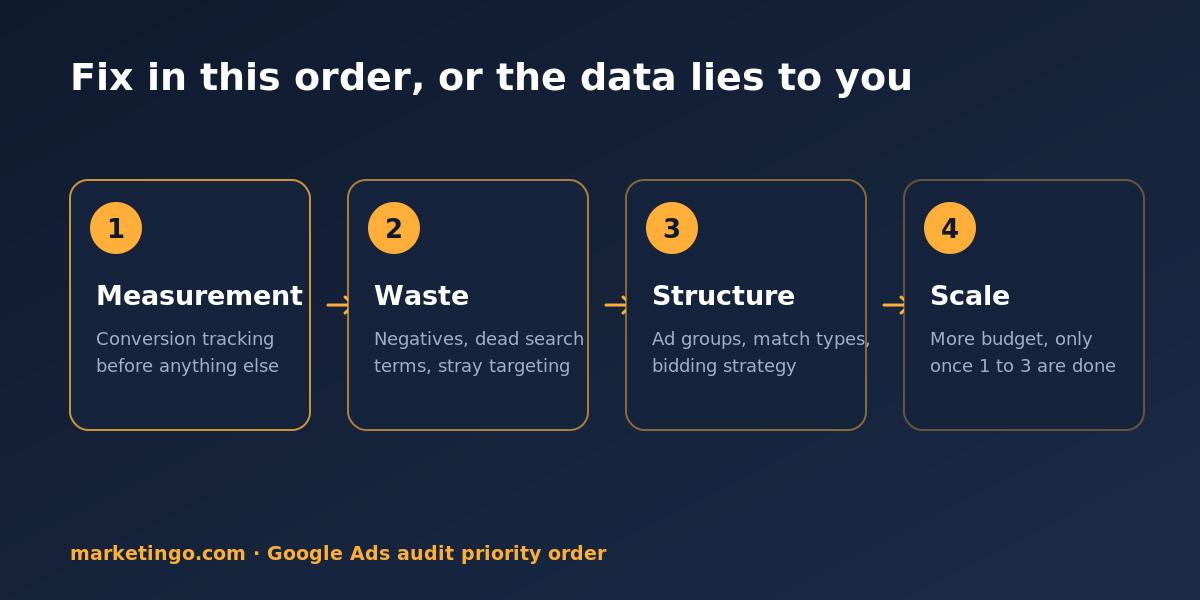
First, measurement. Nothing else is trustworthy until conversion tracking is right. Fix it, then let a week of clean data accumulate before judging performance.
Second, waste. Negatives, zero-converting search terms, runaway keywords, and unintended network or geographic reach. These are same-day changes with immediate savings and no downside risk.
Third, structure. Ad group themes, match types, bidding strategy, and campaign splits. Slower to implement and slower to pay back, but this is what raises the ceiling.
Fourth, scale. Only once the first three are done does more budget make sense. Cutting waste and adding scale in the same week makes it impossible to tell which change did what.
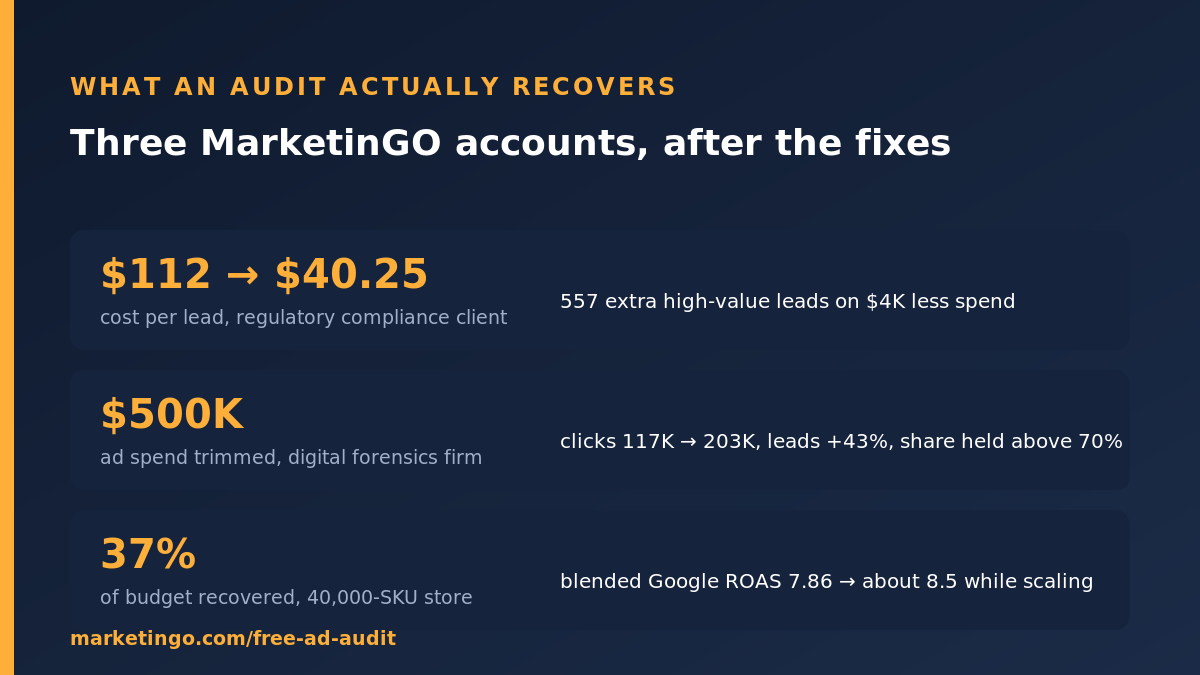
The sequence is not academic. Auditing a digital forensics firm's account, the work trimmed $500K of ad spend while clicks grew from 117K to 203K and leads rose 43%, with market share held above 70%. Cutting the wrong spend shrinks a business. Cutting the right spend funds its growth. For a regulatory compliance client, the same order of operations took cost per lead from $112 to $40.25 and delivered 557 additional high-value leads on $4K less spend over six months.
How often to run one
Quarterly is the working cadence for a stable account, plus a full review after any of these: a change of agency or in-house owner, a website migration, a tracking or consent change, a shift in bidding strategy, or a platform change like the AI Max upgrade. Between full audits, a monthly 30-minute pass over search terms, negatives, and lost impression share catches most drift before it compounds.
Accounts spending over $50K a month deserve a monthly review, simply because a 5% leak at that level costs more than the review does.
Tools, and where they stop
Free graders from WordStream and Adalysis, and the paid checks inside Optmyzr or Adalysis, are good at what they measure: settings, structure, and pattern detection at speed. Use them to shorten the mechanical part of the audit. Google Analytics 4 alongside the Ads interface fills in the post-click behavior the platform cannot see.
What no tool does is know your margin, your close rate, or which leads your sales team refuses to call. That is the gap between an automated score and an audit, and it is where the findings that change a P&L live.
Getting a second opinion
Auditing your own account has one built-in limit, which is that you made most of the decisions you are now reviewing. A second set of eyes tends to find the assumptions rather than the settings.
If you want that second read, MarketinGO runs a free Google Ads audit on live accounts and returns the findings ranked by the spend attached to each one, not a generic score. The free audit covers the same 12 checks above across Google Ads and, where relevant, extends the account audit to the Meta, LinkedIn, and Microsoft campaigns running alongside it. You can see how the same process played out on a live account in the eCommerce Google Ads case study, or read how it applies to high-ticket B2B where a single wasted month costs more than the media.
Request a free Google Ads audit and we will tell you what the account is actually doing with your money.