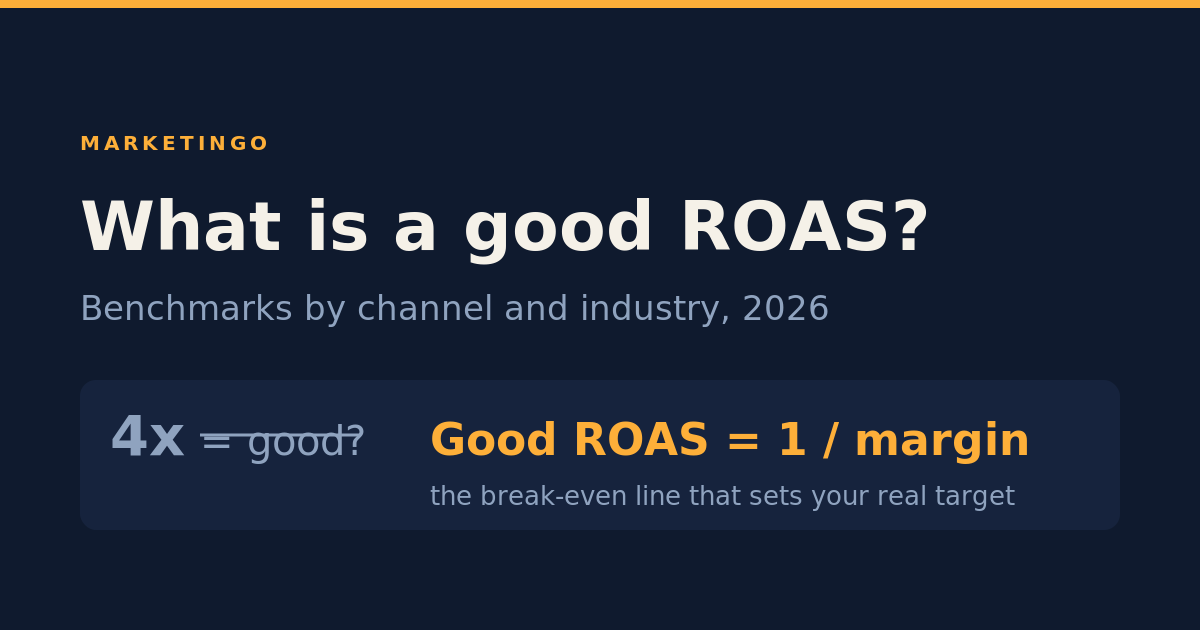
A good ROAS is any return on ad spend that clears your break-even point and leaves profit after the product, the platform, and the overhead are paid. There is no universal number, which is why "4x is good" gets so many advertisers into trouble. This guide gives you the real ROAS numbers for 2026 by channel and industry, the formula that sets your own target, and the reason the headline figure matters less than the margin sitting underneath it.
We wrote it for founders and marketing leads who are staring at a ROAS number and trying to decide whether it is healthy, and for anyone setting a target ROAS for a Google Ads or Meta campaign without a clear read on what the number needs to be. The short version: benchmark against three things at once, your channel, your industry, and your own break-even, and never one of them alone.
The quick answer: what counts as a good ROAS
ROAS, or return on ad spend, measures the revenue generated for every dollar spent on advertising. A 4x ROAS means four dollars of revenue for every dollar of ad spend. That is the easy part.
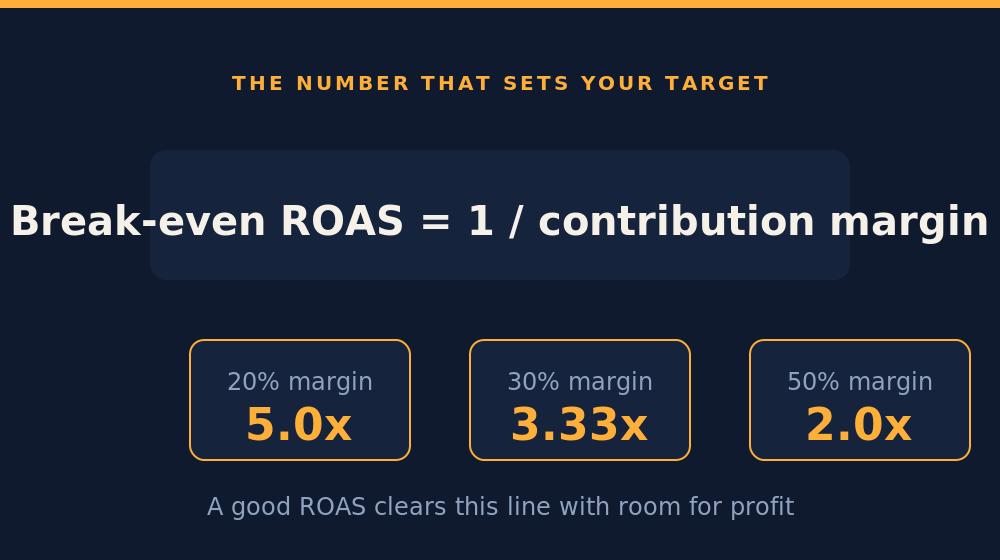
The hard part is that the same 4x can be excellent or ruinous depending on your profit margin. A brand with a 20% contribution margin needs a 5x ROAS just to break even, so 4x loses money on every order. A brand at 50% breaks even at 2x, so the same 4x is comfortably profitable. What a strong ROAS depends on is not published anywhere; it comes from your own margin and P&L. Everything below helps you find your number.
How to calculate ROAS
The ROAS calculation is straightforward: divide the revenue an ad campaign produced by what you spent to run it.
ROAS = revenue from ads / ad spend
Spend $5,000 on a campaign that returns $20,000 in tracked revenue and the ROAS is 4x, sometimes written as 400% or a 4:1 ratio. The metric is deliberately simple, which is its strength and its trap. It tells you the revenue a dollar of ad spend pulled in, but not whether that revenue was profitable or whether the customer would have bought anyway. It also hides the cost per click and the product cost sitting underneath the ratio. Those gaps are why ROAS should never be read on its own, a point the benchmarks below make concrete.
One caution before the numbers. Platform-reported ROAS, the figure Google Ads or Meta shows you, tends to overstate the true, incremental return by roughly 20% to 50% depending on the channel and campaign type, because it claims credit for branded clicks and retargeting conversions that would have landed regardless. Read the dashboard number as a ceiling, not the floor.
What is a good ROAS by channel in 2026
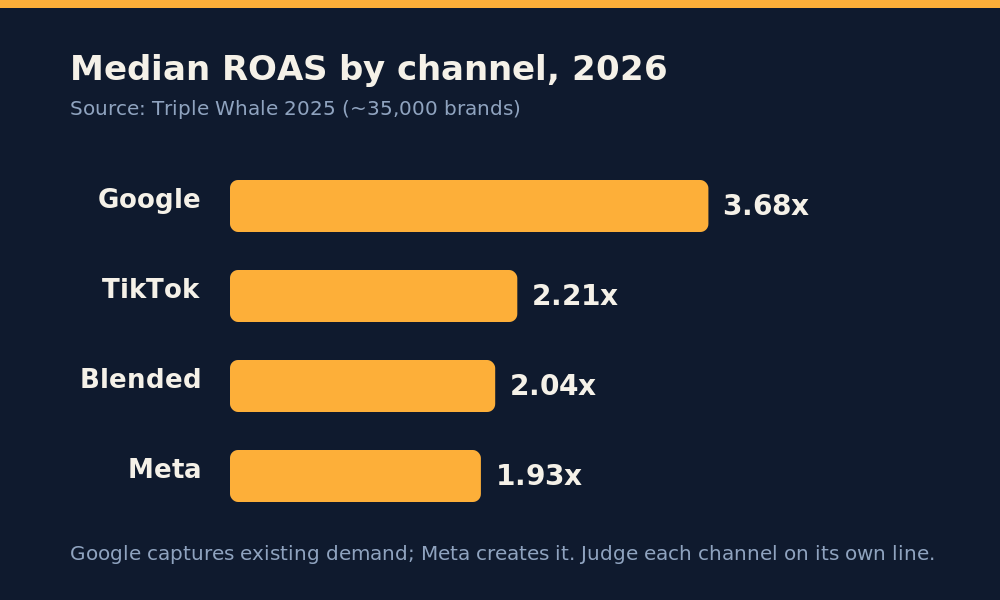
ROAS varies by channel because each platform reaches the buyer at a different point. Search captures demand that already exists; paid social creates demand by interrupting a feed. That structural difference is why Google consistently returns more revenue per dollar than Meta on the same catalog.
Across Triple Whale's full-year 2025 dataset of roughly 35,000 ecommerce brands, median ROAS landed at 3.68x on Google and 1.93x on Meta, with blended ROAS across all channels at 2.04x median and 2.87x average (Triple Whale, 2025 benchmarks). Rules of thumb that hold up in 2026 put Google Shopping in the 5x to 8x range, Meta prospecting and retargeting blended around 3x to 5x, and TikTok nearer 2x to 4x, with TikTok's median slipping to about 2.21x in 2025 as the channel matured.
| Channel | Typical ROAS range (2026) | Median where reported |
|---|---|---|
| Google Search & Shopping | 3x to 8x | 3.68x (Google, Triple Whale) |
| Meta (Facebook & Instagram) | 2x to 5x | 1.93x (Triple Whale) |
| TikTok Ads | 1.5x to 4x | ~2.21x |
| Blended (all channels) | 2x to 3x | 2.04x median, 2.87x avg |
There is a second, larger lever hiding inside these channel averages: campaign type. Inside the same Meta account and vertical, Advantage+ Shopping campaigns average around 4.52x while standard prospecting runs about 2.2x and retargeting sits near 3.60x (Foundry CRO, 2026 benchmarks). The mix of campaign types in your account moves ROAS more than the channel label on the outside of it.
ROAS benchmarks by industry
Industry matters as much as channel, because average order value and margin differ so widely. Triple Whale's 2025 Meta figures run from Automotive at 2.54x at the top down to Media & Publishing at 1.17x at the bottom, with a median around 1.93x. A Meta buyer hitting 2.5x in apparel is at the top of the distribution, not the middle of it.
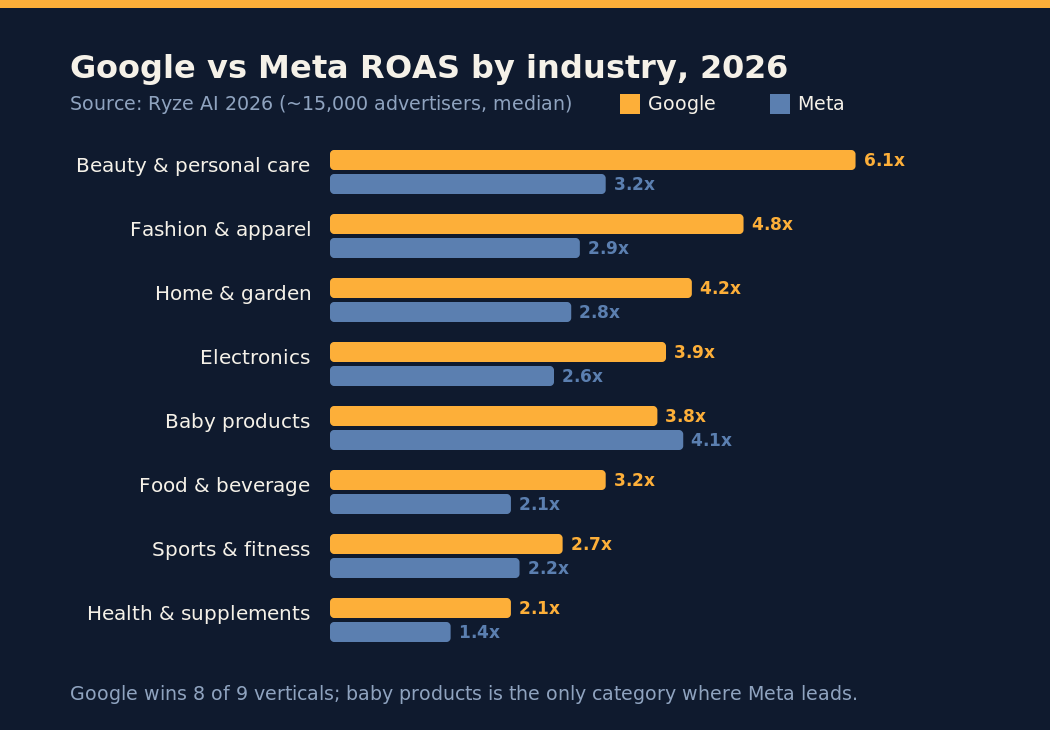
Paired data from Ryze AI, covering about 15,000 advertisers and $2.8 billion in combined spend, shows how the two channels compare inside the same industry:
| Industry | Google ROAS | Meta ROAS |
|---|---|---|
| Beauty & personal care | 6.1x | 3.2x |
| Fashion & apparel | 4.8x | 2.9x |
| Home & garden | 4.2x | 2.8x |
| Electronics | 3.9x | 2.6x |
| Baby products | 3.8x | 4.1x |
| Food & beverage | 3.2x | 2.1x |
| Sports & fitness | 2.7x | 2.2x |
| Healthcare & supplements | 2.1x | 1.4x |
Source: Ryze AI 2026 ROAS benchmarks (median figures). Google wins eight of nine paired verticals; baby products is the only category where Meta leads, because community and emotional creative beat search intent for that buyer. Read any single-source vertical figure with a margin of error: cross-source ROAS for the same industry can differ 30% to 50% because sample sets and attribution models differ.
The point of an industry benchmark is not to copy the number. It is to know where you stand against peers before you layer in the calculation that actually sets your target.
The number that decides everything: break-even ROAS
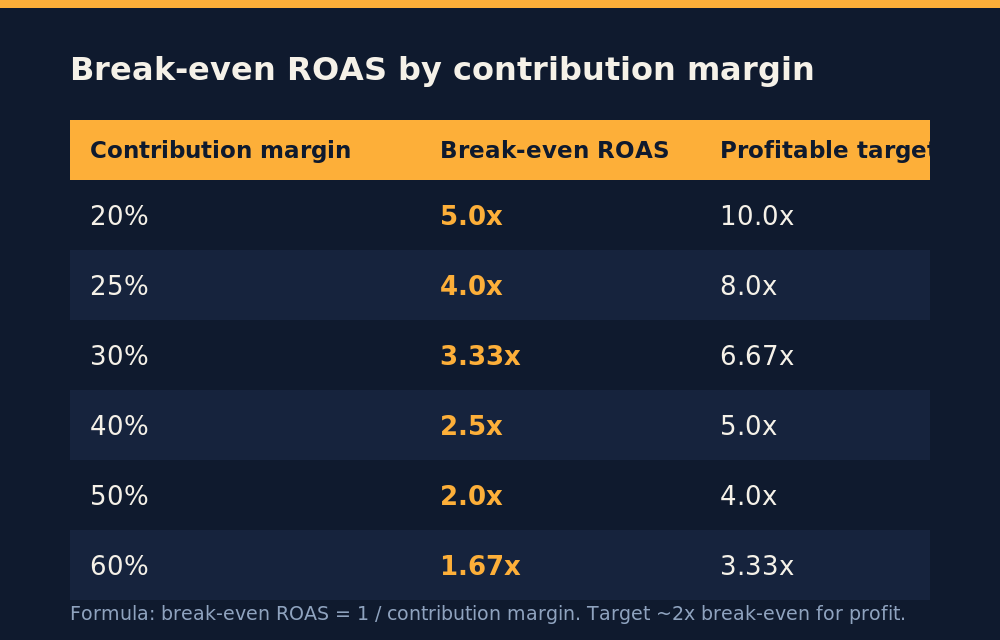
Your real ROAS target is mechanical, not aspirational. Break-even ROAS is one divided by your contribution margin:
Break-even ROAS = 1 / contribution margin %
Use contribution margin, which is revenue minus cost of goods, payment fees, shipping, fulfillment, and returns handling, not the softer gross margin. The table below is the one to keep near your campaign settings.
| Contribution margin | Break-even ROAS | Profitable target (roughly 2x break-even) |
|---|---|---|
| 20% | 5.0x | 10.0x |
| 25% | 4.0x | 8.0x |
| 30% | 3.33x | 6.67x |
| 40% | 2.5x | 5.0x |
| 50% | 2.0x | 4.0x |
| 60% | 1.67x | 3.33x |
Now reread the benchmark tables through this lens. The Meta median for beauty is 1.57x. A beauty brand running a 50% margin breaks even at 2.0x, so the category-median Meta return is structurally unprofitable on that channel alone. Brands that survive at category-median Meta ROAS are almost always running a blended program where Google, retargeting, and repeat purchases carry the blended number above break-even. A healthy ROAS, then, is one that beats your break-even with enough room to fund overhead and profit, typically a target set 20% to 30% above the break-even line at minimum.
ROAS, ROI, MER, and POAS: which metric to trust
ROAS is a revenue metric, and the difference between ROAS and its neighbors is where most reporting goes wrong. ROI compares profit to total investment, so it accounts for cost of goods in a way ROAS does not. Two figures matter more than ROAS once you are past the first campaign.
MER, the marketing efficiency ratio, is total revenue divided by total marketing spend across every channel. It is sometimes called blended ROAS, and it is the number that maps to your P&L because it ignores the attribution squabbles between platforms. A healthy MER for most ecommerce brands sits around 3.0x to 5.0x. POAS, profit on ad spend, divides gross profit rather than revenue by ad spend, baking margin straight into the metric so revenue growth that quietly erodes profit shows up immediately.
The working setup for most advertisers: steer daily on platform ROAS at the campaign level, but judge the business weekly on MER and POAS. Platform ROAS tells the media buyer which dial to turn. The blended and profit numbers tell you whether turning it moved the business.
What is a good ROAS for B2B and lead generation?
ROAS is built for transactions, which makes it a poor fit for B2B and high-ticket lead generation where the "revenue" from a click is a form fill, not a sale. Forcing a ROAS target onto a lead-gen account usually hides more than it shows, because the value of a lead only resolves weeks or months later when it closes.
For paid media that generates leads, the metrics that decide profit are cost per lead, cost per qualified lead, customer acquisition cost, and pipeline or revenue influenced. The durable rule is a customer lifetime value to CAC ratio near 3:1, with an eye on how many months it takes to pay that cost back. Whether a lead is worth its price depends on that lifetime value, not on any single ROAS figure. If you want a ROAS-style read, use POAS against closed revenue once deals land, and manage the top of the funnel on cost per qualified lead in the meantime. You can size the target with the lead generation ROI calculator and sanity-check spend against pipeline before committing budget.
How to improve your ROAS
Improving ROAS is rarely about the creative alone. The levers that move the number, in rough order of impact for most accounts, are these. Fix attribution first, because a ROAS you cannot trust is not worth optimizing. Shift budget toward the campaign types and audiences that already clear break-even, which for many Meta accounts means a larger Advantage+ Shopping share once there are enough conversions to feed it. Tighten the product feed and bidding so spend concentrates on the items that carry real margin, not the ones that merely convert. Then work the landing page and offer, since a higher conversion rate raises ROAS without touching media at all.
The account-level trap is chasing a higher ROAS by cutting spend to only the safest, lowest-funnel clicks. That lifts the ratio and shrinks the business. A slightly lower ROAS at meaningfully higher volume is often the more profitable position, which is exactly why the break-even math matters more than the headline multiple.
Where MarketinGO fits
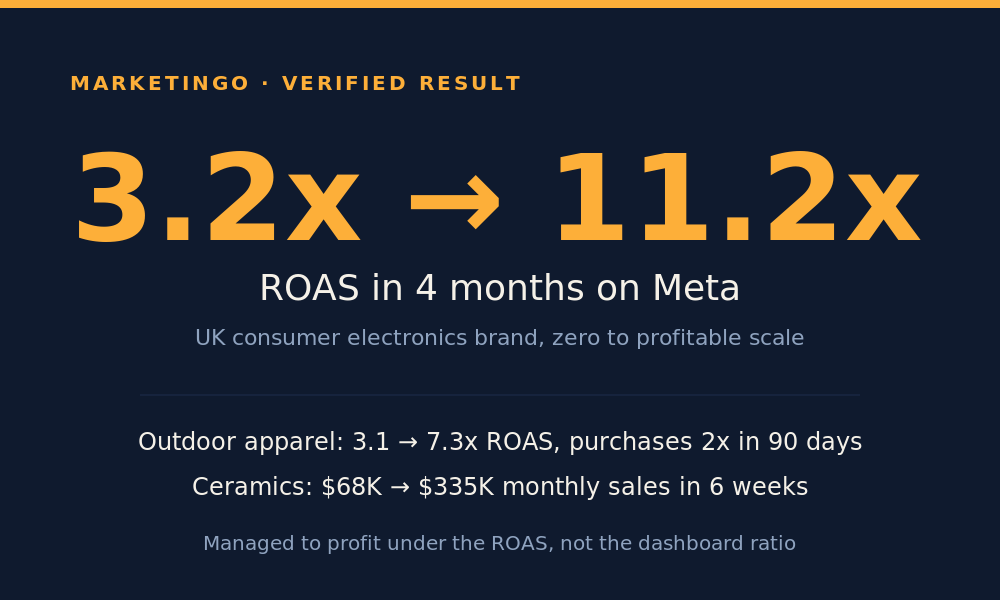
MarketinGO is a paid media agency for US and European clients, running Google, Meta, LinkedIn, and Microsoft Ads for DTC ecommerce and high-ticket B2B lead generation. The through-line across every account is the argument this article makes: manage to the profit under the ROAS, not the ratio on the dashboard. Senior operators run the account, campaigns tend to go live within about a week, and reporting is built around break-even and blended efficiency rather than a vanity multiple.
The results follow from that discipline. A UK consumer electronics brand went from a 3.2x to an 11.2x ROAS and from zero to profitable scale in four months on Meta. An outdoor apparel brand lifted ROAS from 3.1 to 7.3 and doubled purchases in 90 days, during its off-season. A ceramics brand grew from $68K to $335K in monthly sales in six weeks. On a roughly 40,000-SKU catalog, cutting the 37% of budget wasted on zero-revenue products lifted blended Google ROAS from 7.86 to about 8.5 while spend scaled. On the lead-gen side, a regulatory-compliance company saw cost per lead fall 64%, from $112 to $40.25, and a document-redaction product cut cost per trial about 58%.
If you are not sure whether your current ROAS is good or just busy, the fastest way to find out is a free ad audit, then pressure-test your own break-even with the ecommerce ROAS calculator. Our Google Ads management page covers how we run the channel for DTC and ecommerce brands, and the fashion ecommerce case study shows what moving ROAS from 3.1 to 7.3 looked like in practice.
This article is informational and reflects 2025 to 2026 benchmark data from third-party sources cited above; your own results depend on margin, offer, and market. ROAS benchmarks change, so treat the figures as directional.