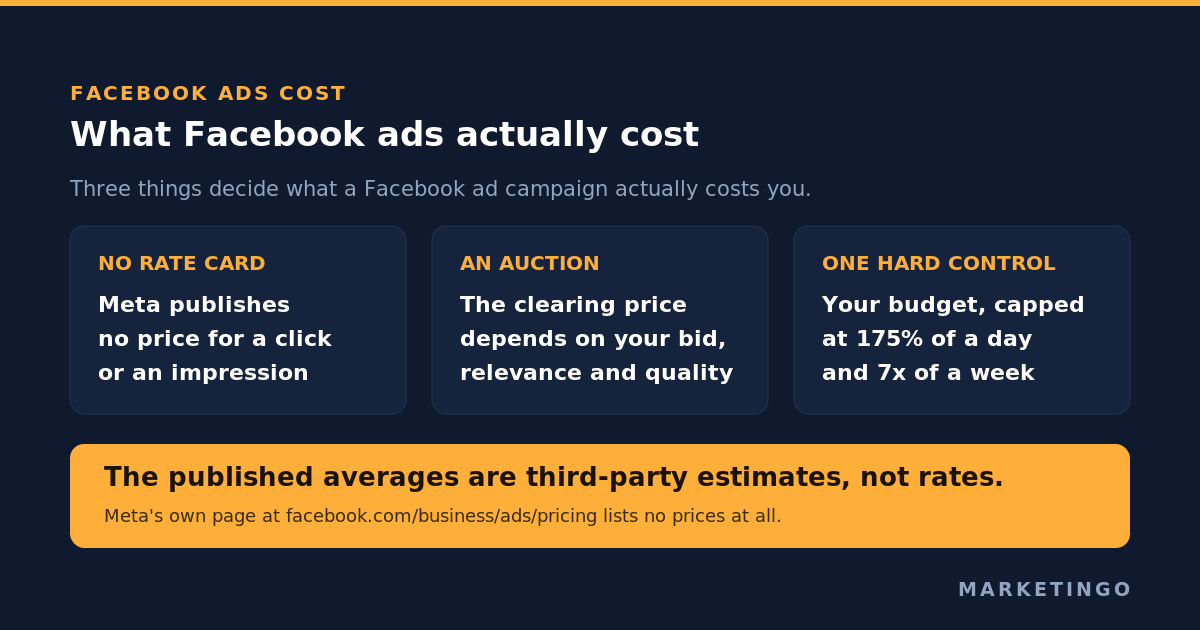
Facebook ads cost, in the only sense that binds, exactly what you set as your budget. Meta charges you through an auction with no published price list, so the cost per click or per thousand impressions you end up paying is an output of your account, not an input you can look up. Across the estimates circulating for 2026, the average cost per click sits somewhere between $0.62 and $1.92, and the average cost per thousand impressions between roughly $11 and $28. Those ranges are wide enough to be useless for planning, and the reason they are wide is worth more of your attention than the midpoints.
There is a better set of numbers available, and it comes from Meta itself. Meta does not publish prices, but it does publish the rules that govern what leaves your account: a daily spending limit of 175% of your daily budget, a weekly ceiling of seven times that budget, a minimum budget tied to your cost per result, and an explicit statement that its own cost controls are not guaranteed. Those are checkable facts rather than survey averages, and they tell you more about what a Facebook ad campaign will cost you than any industry benchmark table.
The short answer, and the page that refuses to give it
Meta runs a page at facebook.com/business/ads/pricing. The word "pricing" is in the URL. It publishes no prices.
What it says instead is that "there are many factors that contribute to an ad campaign's cost, and while there isn't a one-size-fits-all answer to these questions, there are strategies that can help you get more from your ad spend" (Meta for Business). That page currently ranks first in Google for this question. The Meta help article titled "How much it costs to advertise on Meta technologies" ranks close behind it and takes the same line: "When you advertise on Meta, you decide how much you want to spend" (Meta Business Help Center).
This is not evasion. It is an accurate description of how the product works. Meta sells attention through a real-time auction, and the clearing price in that auction depends on who else wants the same person at the same moment, how likely that person is to do what you asked for, and how good your ad is. None of those are knowable in advance, and two of them are things you control.
So the honest answer to "how much do Facebook ads cost" has three parts. Your total spend is whatever you set, capped by rules Meta publishes. Your cost per result is set by the auction and by your own conversion economics. And the published averages are third-party estimates built from samples nobody discloses.
The 2026 benchmark numbers, and how far apart they are
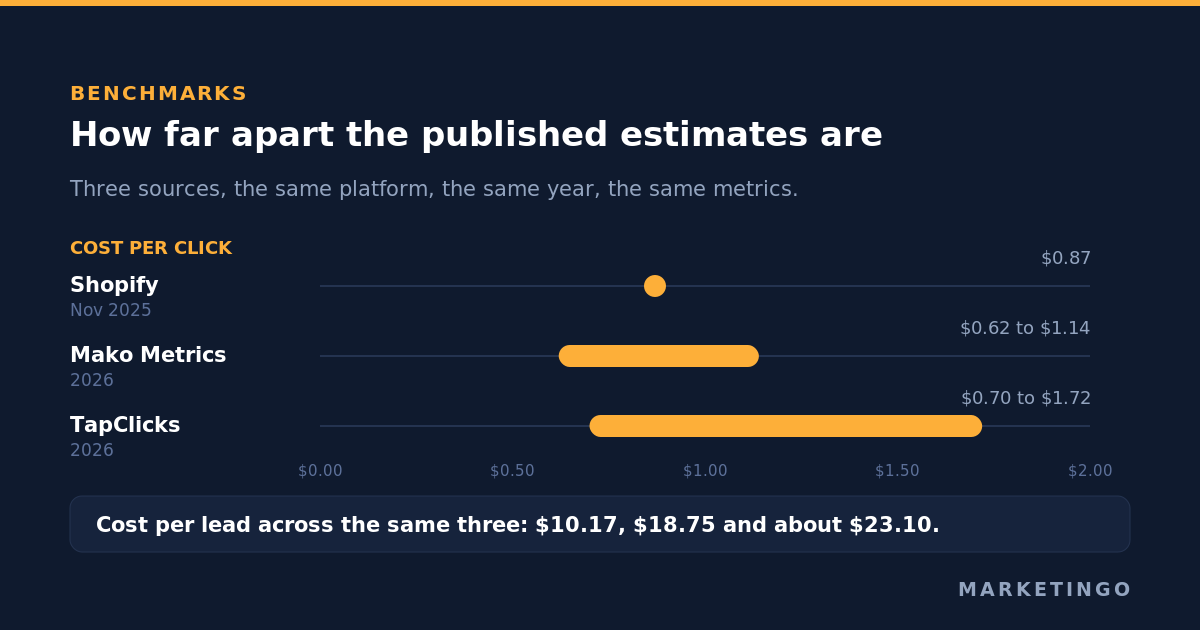
Every article competing for this query carries a cost table. The tables disagree, in the same year, for the same platform, on the same metrics.
| Source | Average cost per click | Average cost per thousand impressions | Average cost per lead | Period stated |
|---|---|---|---|---|
| Shopify | $0.87 | $16.06 | $18.75 | November 2025 |
| Mako Metrics | $0.62 to $1.14 | $11.62 | $10.17 | 2026 |
| TapClicks | $0.70 to $1.72 | $6.80 to $28.40 | about $23.10 | 2026 |
Shopify reports 87 cents per click and $16.06 per thousand impressions, and is transparent that the figures describe November 2025 and come from a third-party spend tracker. That is the most honest entry in the set, and note what it means: a page Google ranks for a 2026 cost question is reporting late-2025 data, because that is the most recent period the underlying tracker had closed.
Look at the cost per lead column. Mako Metrics puts it at $10.17, Shopify at $18.75, and the dataset TapClicks cites at around $23.10. The highest is more than twice the lowest, and all three are describing lead generation on Facebook.
The cost per thousand impressions column hides something worse. Mako Metrics publishes a cost per thousand impressions table by vertical in which finance and insurance sits at $11.37, second cheapest of the six industries listed. TapClicks publishes a table in which finance and insurance runs $17.90 to $28.40 and is flagged as the most expensive industry on the platform. Same industry, same year, same metric, and one source has it near the bottom of the range while the other has it at the top. Both tables agree that finance has the highest cost per click, at around $3.77 to $3.89. An advertiser planning a finance awareness campaign from the wrong one of those two pages is out by a factor of two and a half.
To its credit, TapClicks says so out loud: "benchmark reports disagree with each other more than they agree." Its own methodology table shows why. One figure is a blended average across all campaign objectives, another is a median for traffic campaigns only, another is a median for lead generation campaigns. A traffic campaign at $1.10 per click looks bad against the $0.70 traffic median and fine against the $1.72 blended average, and the two numbers are describing different things.
There is one more feature of this citation chain worth knowing. Follow the sources far enough and they converge on a small set of secondary aggregators rather than on Meta. Mako Metrics cites Stackmatix and Neal Schaffer, which in turn aggregate Cropink and Ninja Promo. TapClicks cites Digital Applied, Zeely, Influee, Superscale and a Databox panel. None of it originates from a figure Meta published, because Meta has not published one.
That does not make the benchmarks worthless. It makes them unusable as a target. A cost per click of $1.40 is a disaster in one account and a bargain in another, and no table can tell you which one you are in.
Why there is no rate card: the auction, in Meta's own words
Meta's help article on ad auctions is the most useful primary source on this subject, and it contains a detail that almost nobody repeats.
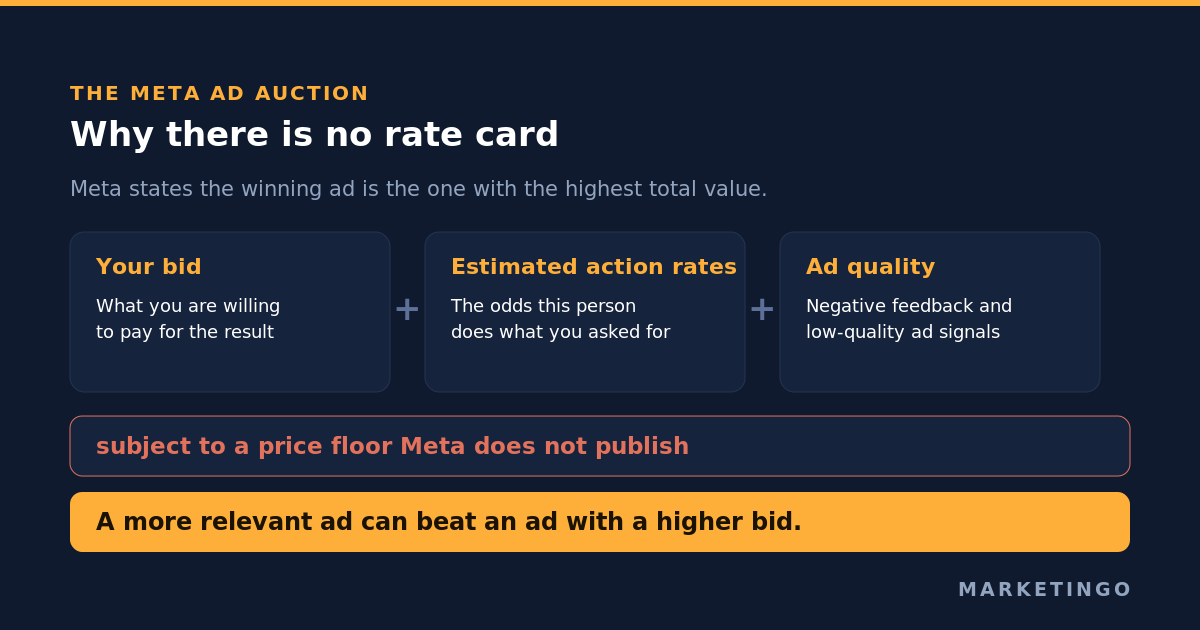
The winner of each auction is "the ad with the highest total value, subject to a price floor (minimum price) that may affect whether an ad is shown and the price paid" (Meta Business Help Center). Total value combines three things: your bid, the estimated action rates (Meta's probability estimate that this specific person does the thing you optimized for), and ad quality, measured partly from whether people hide your ad and partly from content signals such as sensationalized language.
Two consequences follow from that sentence, and they are the whole explanation for why your Facebook advertising cost is not a published number.
First, there is a price floor and Meta does not say what it is. A floor exists, it varies, and it can stop your ad from being shown at all. Any average cost per thousand impressions computed across advertisers is therefore an average across different floors, not a market rate.
Second, relevance is priced. Meta states plainly that "an ad that's more relevant to a person could win an auction against ads with higher bids." Your creative and your targeting are not just performance levers, they are price levers. The same budget, aimed at the same audience, with a better ad, buys more. That is the mechanism behind almost every legitimate claim you will read about reducing Facebook ad costs, and it is why cost benchmarking across accounts tells you so little.
Meta also commits to one boundary in the same article: auction adjustments "will not cause us to charge you more than your bid to show your ad."
The numbers Meta does publish: how far your daily budget can stretch
This is the part of Facebook ads pricing that is genuinely documented, genuinely surprising, and almost absent from the pages competing for this query.
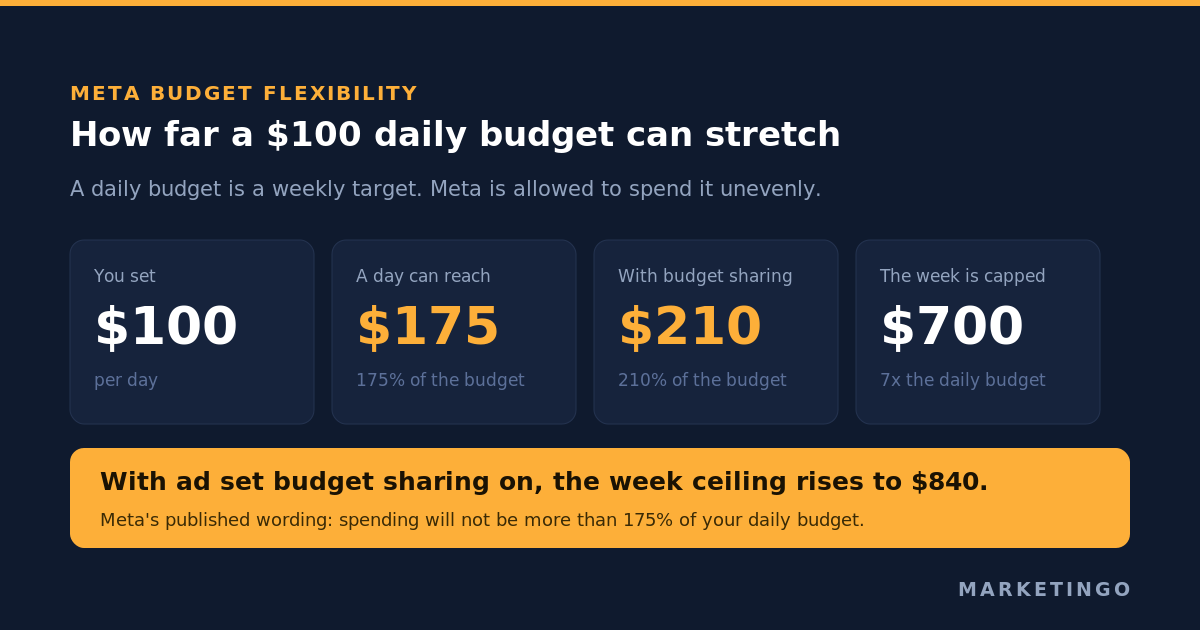
When you set a daily budget, you are not setting a daily cap. You are setting a weekly spending target that Meta is allowed to distribute unevenly. From Meta's help article on daily budgets (Meta Business Help Center):
- On days when better advertising opportunities exist, Meta may spend up to 75% over your daily budget.
- If ad set budget sharing is on, Meta may additionally share up to 20% of your flexible daily budget with other ad sets, which takes a single day as high as 210% of the number you typed in.
- For every day ending at midnight, spending "won't be more than 175% of your daily budget."
- For every week ending Saturday at midnight, spending "won't be more than 7 times your daily budget."
- If you start an ad set mid-week or change the daily budget mid-week, Meta prorates the rest of the week and adds a margin allowing spend to rise up to a further 25% of the daily budget.
Meta's own worked example: a $100 daily budget can spend up to $175 on a given day, up to $210 with budget sharing on, and will not exceed $700 in a calendar week, or $840 with sharing.
| What you set | What a single day can reach | What the calendar week is capped at |
|---|---|---|
| $100 per day, budget sharing off | $175 | $700 |
| $100 per day, budget sharing on | $210 | $840 |
| $500 per day, budget sharing off | $875 | $3,500 |
| $500 per day, budget sharing on | $1,050 | $4,200 |
Two practical things fall out of this. A finance team looking at a single day's spend and asking why it ran 75% over plan is usually looking at documented behaviour, not a fault. And a client who sets $100 a day expecting $3,000 a month should be told at the start that the week, not the day, is the unit Meta actually respects.
Meta also gives a warning worth quoting for anyone who manages budgets by hand late in the day: if you cut a daily budget from $200 to $100 at five in the afternoon, "the system may have spent over your new daily budget of $100 already" (Meta Business Help Center).
The contradiction inside Meta's own documentation
Here is a finding that survived a direct check of both pages, and that changes what you should actually budget.
Meta publishes a rule connecting your budget to your cost per result. It publishes that rule twice, with two different multipliers.
On the minimum budgets page: "If you use the cost per result goal bid strategy, your daily budget should be at least 5 times the amount of your cost per result goal. For example, if you set a cost per result goal of $5 your daily budget should be at least $25" (Meta Business Help Center).
On the performance goals page: "In general, your daily budget should be at least 10 times the average cost of your performance goal. For example, if you want to optimize for link clicks and your average cost per link click is $5, your daily budget should be at least $50" (Meta Business Help Center).
Same platform, same relationship, two multipliers a factor of two apart. The two pages are not quite describing an identical situation: one is scoped to the cost per result goal bid strategy and phrased as a minimum requirement, the other is a general recommendation tied to your observed average cost. But an advertiser reading either page in isolation walks away with a materially different daily budget for the same campaign, and neither page points at the other.
Take the higher figure. The 5x rule is framed as the threshold below which Ads Manager will warn you, which is a floor for delivery rather than a floor for learning. The 10x rule is framed as the budget that lets the ad set actually accumulate results. If your cost per purchase is $40, a $200 daily budget gives the delivery system five purchases a day to learn from; $400 gives it ten. Meta separately recommends "50 to 100 or more weekly conversions for best performance" (Meta Business Help Center), and at ten results a day you reach the bottom of that band and at five you do not.
That single arithmetic check is usually a better answer to "what should I budget for Facebook ads" than any benchmark table, because it works from your own cost per result rather than from someone else's sample.
What Facebook ads cost per month
Most people asking what it costs to advertise on Facebook are really asking what to put in a monthly plan. That number is built, not looked up, and it takes two inputs you already have.
Start from the result you need and what one is worth. Monthly budget equals the number of sales or leads you need, multiplied by the cost per result your margin allows. If you need 150 purchases and your break-even allows $25 each, the base is $3,750 a month. Add 20% to 30% for testing, because new creative and new audiences spend through a learning period before they produce at rate.
Then sanity-check it against the delivery floor rather than the other way round. Divide the monthly figure by 30 to get a daily budget, and compare that against ten times your cost per result. If your cost per purchase is $40, the delivery floor is $400 a day, or roughly $12,000 a month, for a single ad set optimizing on purchases. A plan of $3,000 a month against a $40 cost per purchase is not a small version of that campaign, it is a different campaign, and the honest options are to optimize for an earlier event, to cut the number of ad sets so the budget concentrates, or to raise the number.
Two adjustments apply on top.
Seasonality. The auction reprices when more advertisers want the same attention. Cost per thousand impressions runs meaningfully above the annual average through the fourth quarter and peaks around Black Friday, and sits below it in January and February. If your annual budget is fixed, weight it toward the cheap months for testing and the expensive ones for proven creative rather than splitting it evenly across twelve.
Competitive industries. The cost of advertising on Facebook differs by a factor of eight between the cheapest and most contested verticals. Apparel and retail sit near the bottom on cost per click; finance, insurance and home improvement sit at the top, because one conversion is worth far more there. A high cost per click in a high-value category is not a problem to fix, it is the market pricing the customer correctly.
One structural note for anyone running several ad sets. Advantage+ campaign budget, which Meta also calls campaign budget, sets one budget at the campaign level and reallocates it across ad sets in real time. Whether you use a daily or lifetime budget, Meta's guidance is that this reduces the risk of under-delivery, because budget moves freely instead of sitting stranded in an ad set that cannot spend it.
What you can control, and what Meta declines to guarantee
Meta offers three families of bid strategy, and the difference between them is the difference between controlling your spend and controlling your cost.
Spend-based bidding (highest volume, highest value) tells Meta to spend the whole budget and get as much as it can for it. Cost per result is an outcome, not a constraint.
Goal-based bidding (cost per result goal, ROAS goal) tells Meta to chase a cost or a return target. This is what most advertisers reach for when costs run high.
Manual bidding (bid cap) sets the maximum you will bid in any single auction, and Meta is explicit that it "is meant for advertisers who have a strong understanding of predicted conversion rates."
The sentence worth reading twice appears against both goal-based options: "Adherence to cost per result goal limits is not guaranteed," and, for the return target, "Adherence to ROAS amount is not guaranteed" (Meta Business Help Center). Meta says this in its own documentation, unprompted, twice in one page. A cost per result goal is a steering input, not a ceiling. If your plan depends on Facebook ads costing no more than a fixed amount per lead, the only hard control in the product is the budget, plus the campaign and account spending limits described in the billing documentation.
This matters for how you brief a client. "We will hold cost per lead at $40" is a promise the platform does not make. "We will hold spend at $6,000 and report cost per lead weekly against your break-even" is a promise the platform does support.
The cost that decides everything is not cost per click
An account can halve its cost per click and lose more money. Cost per click is an intermediate metric, and Facebook ads are priced by an auction that will happily sell you cheap clicks from people who never buy.
The number that decides whether your Facebook advertising cost is acceptable is your break-even, and it comes from your margins, not from Meta. For an ecommerce brand it is break-even ROAS: the return on ad spend at which the gross profit on an order exactly covers what the order cost to acquire. For a business selling a service or a subscription, it is the break-even cost per lead: gross profit per customer multiplied by your close rate. Our ecommerce ROAS calculator and lead generation ROI calculator both work from those inputs rather than from platform averages.
A real example of why the average is the wrong target. A UK consumer electronics brand came to us with margins slim enough that Meta had to return 8.0 or better to be profitable at all, a threshold far above the blended returns most benchmark tables treat as healthy. The account went from 3.2 to 11.2 on Meta over four months. Had we been managing toward a published "good ROAS" figure of 3 or 4, that brand would have been losing money the entire time while the dashboard looked fine.
The same logic runs the other way. A fashion brand we scaled from 3.1 to 7.3 doubled purchases in 90 days during its off-season, which only reads as a win because the break-even was known before the scaling started. If you want to understand how return on ad spend is calculated and where reported figures diverge from banked revenue, the ROAS formula article covers the arithmetic and what is a good ROAS covers the benchmark question directly.
What actually moves your Facebook ad costs
Given that the auction prices relevance, the levers that reduce Facebook ad costs are the ones that improve Meta's estimate of whether the person in front of your ad will act.
Creative quality and ad relevance. Ad quality is one of the three components of auction value, and Meta measures it partly by negative feedback. Its ad relevance diagnostics report grades each ad on quality, engagement rate and conversion rate against other ads competing for the same people, so a "below average" flag is a direct reading of why you are paying more than the advertiser next to you. Frequency is the mechanic underneath it: the same person seeing the same ad for the fifth time is less likely to act and more likely to hide it, so both halves of your auction value fall at once. Refreshing creative is a cost intervention, not only a brand one.
The performance goal you chose. Meta states that a conversion may cost more than a landing page view and that your budget must accommodate the goal you set. Choosing an easier optimization event genuinely lowers cost per result, and genuinely changes what you are buying. Optimizing for link clicks when you need purchases is the most common way an account produces a flattering cost per click and a terrible cost per acquisition.
Audience targeting and overlap. Meta's own guidance on ad budgets suggests ad sets with a target audience of at least two million often perform better, because the auction has more chances to find a responsive person. Running many narrow ad sets against overlapping audiences makes you bid against yourself and fragments the conversion volume each ad set needs to learn. Narrow targeting feels like precision and prices like scarcity.
Ad placement. Restricting delivery to a single placement removes the cheapest inventory from the auction, including the Meta Audience Network at the bottom of the range. Meta's position is that more placements give the delivery system more opportunities to find a responsive person at a lower price, which is why the average cost per mille you end up paying is really a weighted average across wherever your ads were allowed to run.
Seasonality. Auction prices rise when more advertisers want the same attention. The fourth quarter, and the Black Friday window in particular, reprices every ecommerce audience. An average cost per thousand impressions measured in November tells you very little about what the same audience costs in February, which is another reason to distrust a benchmark table without a date range.
Conversion measurement. This is the lever most accounts get wrong, and it does not look like a cost problem. If the Conversions API is not passing events back reliably, Meta's estimated action rates are built on partial data, the auction underprices your relevance, and your reported cost per result rises for reasons that have nothing to do with the market. A cost investigation that skips measurement usually ends up blaming the creative.
What Instagram ads cost, and why it is the same question
Instagram ads are bought in Meta Ads Manager, out of the same budget, through the same auction. There is no separate Instagram rate. What changes between Facebook and Instagram is the placement, and placement moves the cost per thousand impressions more than industry does.
The published placement figures come from the same aggregator chain as the headline averages, so treat them as directional rather than exact. Mako Metrics reports Instagram Feed at $9 to $12 per thousand impressions, Facebook Feed at $7 to $10, Instagram Stories at $6 to $9, Facebook Stories at $5 to $8, Reels at $5 to $7, and Audience Network at $2 to $4.
The ordering is the useful part. Instagram Feed is the most expensive placement per thousand impressions and usually the highest intent. Reels is cheap because Meta has spent two years seeding that inventory, and the gap has been closing as advertisers move in. Audience Network is the cheapest, and for conversion campaigns that is usually a warning rather than an opportunity, because the traffic quality is lower.
This is why restricting placements is a false economy in most accounts. Choosing only Instagram Feed does not buy you better people, it removes the cheaper inventory from your auction and raises your blended cost. Meta's own guidance in its ad budget material is to turn on Advantage+ placements or select at least six placements manually, because more placements give the delivery system more chances to find someone who will act.
If you are boosting from an Instagram profile rather than running campaigns, Meta's stated recommendation is to start with at least $5 and run for more than six days, so the delivery system has enough signal to find an audience (Meta Business Help Center). That is a floor for learning, not a budget for a campaign that has to produce sales.
The cost controls that are actually hard limits
Since the cost goals are advisory, it is worth knowing which controls Meta does enforce. There are three, and all of them cap spend rather than cost per result.
The budget itself, daily or lifetime, capped at the day and week limits described above. A lifetime budget is the tighter of the two, because total cost stays inside the amount you set even as daily spend fluctuates.
The campaign spending limit, which sets a maximum for one campaign. The account spending limit, which sets a maximum across every campaign in the ad account. Meta describes both as the cost control methods that prevent overspending (Meta Business Help Center).
One operational caution on lifetime budgets. If you lower one, Meta requires the new amount to be at least what you have already spent plus 10% of what you spent in the last two days. Spend $300 so far with $100 of it in the past two days, and the lowest you can set the budget to is $310.
When a cost problem turns out to be a structure problem
Three patterns account for most of the accounts that arrive with a Facebook ads cost complaint.
The first is budget spread too thin. Six ad sets at $30 a day, each optimizing for purchases at a $45 cost per purchase, means no ad set ever reaches the volume Meta says it needs. Every one of them stays in the learning phase, and learning-phase costs are the ones being reported as the account's true cost.
The second is a cost per result goal set below what the account has ever achieved, on the theory that it will force Meta down. It does not force Meta down. It restricts delivery, the ad set underspends, volume collapses, and the cost per result often rises because the only auctions still being won are the odd ones.
The third is a mismatch between the channel and the funnel. Facebook and Instagram are demand generation surfaces. For a high-ticket business-to-business offer, they are frequently the cheapest way to create awareness and the most expensive way to close, and judging them on last-click cost per lead against a search campaign will always make them look expensive. That is a measurement design question before it is a cost question, and it is why we run Meta advertising alongside Google Ads under one full-funnel strategy rather than as isolated channels.
How to find your own cost floor in 30 days
Since no published average applies to your account, produce your own number. This is the sequence we use on a new ecommerce or high-ticket business-to-business account, and it takes about a month.
Week one: establish the break-even. Calculate gross profit per order or per customer, then derive the break-even return on ad spend or cost per lead. Everything after this is measured against that number rather than against a benchmark.
Week one: verify the measurement. Confirm the Conversions API is sending server-side events, that deduplication against browser events is working, and that the conversion you optimize for is the one that makes money. A cost baseline built on broken tracking is worse than no baseline.
Weeks two and three: buy the data deliberately. Set a daily budget at roughly ten times your expected cost per result, using Meta's own recommendation, run highest volume rather than a cost goal, and leave it alone. Every significant edit resets the learning phase. Budget for the week rather than the day, because the platform does.
Week four: read the distribution, not the average. Pull cost per result by audience, placement, creative and day of week. What you want is the spread. The cheapest decile tells you what this account can achieve; the most expensive tells you what to cut. Your real Facebook ads cost is the number the good half of the account produces once the bad half stops consuming budget.
From there, a cost goal becomes usable, because you are now setting it near a cost the account has actually delivered rather than a number from a table.
Getting a second read on the account
Most accounts that look expensive are not paying too much per click. They are buying the wrong result, measuring it incompletely, or spreading budget across ad sets too thin to learn. Those are all visible from the outside in about an hour.
If you want that hour, our free ad audit covers exactly this: what your cost per result is by segment, where the budget is being consumed without producing anything, whether the conversion events feeding the auction are complete, and what your break-even actually allows. It is a real review of your account rather than an automated score, and it ends with a written set of changes ranked by what they are worth.
You can also read how the same approach works on a large catalogue, where cost problems hide in product-level waste rather than in the auction, in our dental supplies ecommerce case study, or compare the Meta side against the search side in Google Ads audit checklist. If you are evaluating who should run the account rather than how, best Meta ads agencies for ecommerce covers that ground.