The ROAS formula is one division:
ROAS = revenue from advertising / advertising costs
Spend $5,000 on an ad campaign that returns $20,000 in tracked revenue and your ROAS is 4, usually written 4x, 4:1, or 400%. That is the whole calculation, and it is why return on ad spend became the default marketing metric on every dashboard.
The arithmetic is not where accounts go wrong. The inputs are. Two advertisers can run the identical advertising campaign, pull the identical data, and report ROAS figures that differ by more than half, because they disagree about what belongs in the numerator and what belongs in the denominator. This guide covers the formula, the ratio and percentage forms, the four different ROAS numbers one account can legitimately produce, and the one place the formula gets typed in wrong often enough to burn budgets.
If what you actually want is a target to aim at, read what is a good ROAS in 2026 next, which has the benchmarks by channel and industry.
The ROAS formula, stated plainly
There are two ways to express the same result, and the difference matters more than it should.
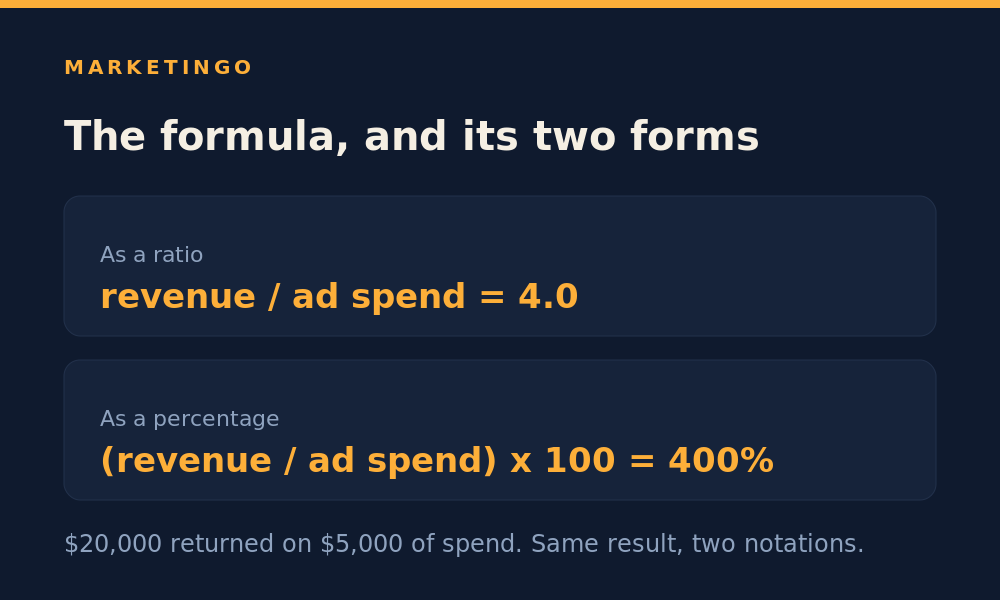
As a ratio: ROAS = revenue / ad spend. A $20,000 return on $5,000 of spend gives 4, written 4x or 4:1.
As a percentage: ROAS = (revenue / ad spend) x 100. The same campaign is 400%.
Both describe the amount of revenue earned for every dollar spent on advertising. A 4x ROAS means every dollar of ad spend brought back four dollars of revenue. Google's own documentation uses the percentage form in its bidding settings and the ratio form in its reporting columns, which is the source of a mistake covered further down.
Worked through a second example, on a smaller advertising campaign: $2,400 in spend, $7,200 in tracked revenue. Divide 7,200 by 2,400 and the ROAS is 3, or 300%. Every dollar you spend returned three dollars of ad revenue. Whether 300% is a good result depends entirely on your profit margin, which is a separate question from the calculation itself.
What a given ROAS value actually means
The ratio is unitless, so reading it takes a second of translation.
| ROAS | Percentage | Revenue per $1 of ad spend | Plain reading |
|---|---|---|---|
| 0.8 | 80% | $0.80 | Losing money before costs |
| 1.0 | 100% | $1.00 | Revenue equals spend, no margin recovered |
| 1.5 | 150% | $1.50 | Positive ROAS, profitable only above a 67% margin |
| 3.0 | 300% | $3.00 | Break-even at a 33% contribution margin |
| 4.0 | 400% | $4.00 | Break-even at a 25% contribution margin |
| 10.0 | 1000% | $10.00 | Strong, and often a sign of spend concentrated on branded search |
A ROAS of 1.5 is the one people misread most. It is above 1, so it looks positive, and it is. It is also below break-even for any business with a contribution margin under 67%, which is nearly every product business. Positive ROAS and profitable ROAS are different tests.
ROAS and ACoS are the same number inverted. Advertising cost of sale, the metric Amazon sellers use, is ad spend divided by ad revenue. That makes ACoS the reciprocal of ROAS: a 25% ACoS is a 4x ROAS, a 20% ACoS is 5x, a 50% ACoS is 2x. Convert with 1 divided by the other and the two are interchangeable.
The two inputs nobody defines
The formula is fixed. What you feed it is not, and this is where most ROAS calculations quietly break.
What counts as revenue? Platform-reported conversion value is gross order value at checkout. It has not been reduced by returns, discount codes, gift cards, shipping subsidies, taxes, or cancelled orders. The gap is not small. The National Retail Federation and Happy Returns, in the 2025 Retail Returns Landscape, put returns at 15.8% of retail sales for 2025, worth $849.9 billion, and estimated the return rate on ecommerce orders specifically at 19.3%. In 2024 the figures were 16.9% and $890 billion.
Apply that to the numerator. A store reporting a 4x ROAS on gross checkout value, with a category-typical 19% online return rate, is really returning about 3.24x on revenue it keeps. The advertising did not get worse. The measurement was optimistic.
What counts as advertising costs? Media spend is the obvious part. The parts advertisers leave out are agency or in-house management fees, creative production, the analytics and attribution tools the account depends on, platform fees on some channels, and any affiliate or influencer commission tied to the same orders. A brand paying $50,000 in media, $6,000 in management, and $4,000 in creative is spending $60,000 to acquire that revenue, not $50,000. Reported on media alone the ROAS reads 4.0. Reported on total advertising costs it reads 3.33.
Neither version is wrong. They answer different questions. Media-only ROAS tells you whether the auction is working. Fully loaded ROAS tells you whether the marketing campaign is worth running. The failure is comparing one to the other, or quoting one figure while making a decision that requires the other.
Four ROAS numbers from the same account
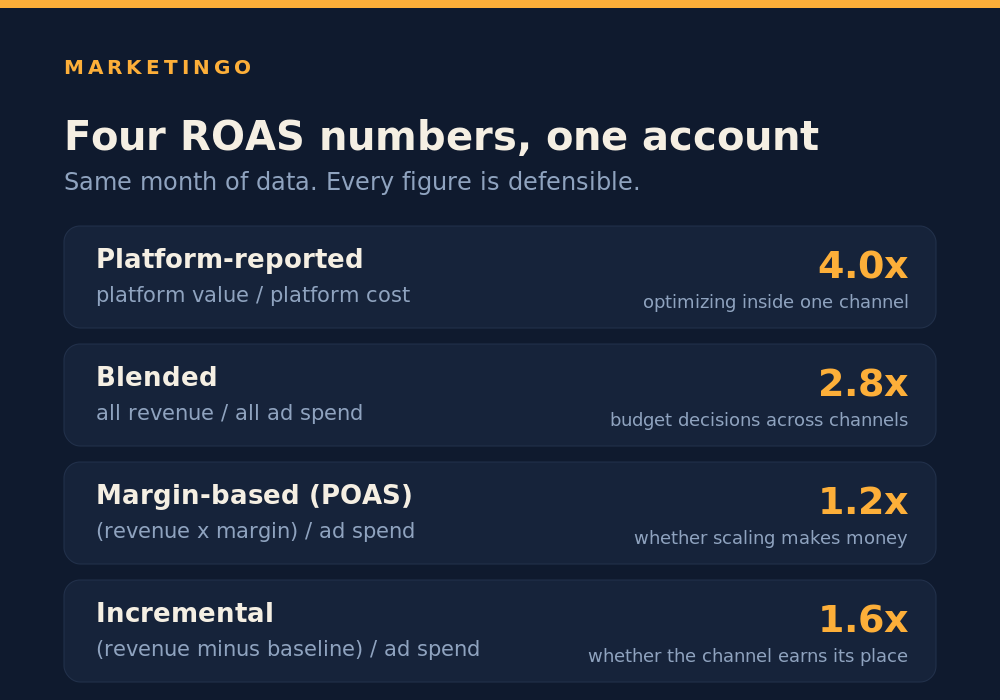
Ask four analysts to calculate ROAS on one month of data and you can get four defensible answers. Each has its own formula and its own use.
1. Platform-reported ROAS. Conversion value divided by cost, inside Google Ads or Meta Ads Manager. Formula: platform conversion value / platform cost. Use it to compare campaigns and ad sets against each other inside a single platform. Do not use it to judge the business, because every platform claims credit generously and none of them sees the others.
2. Blended ROAS. Total revenue from every source divided by total ad spend across every channel. Formula: all revenue / all ad spend. This is the number that reconciles with the bank account, and it is the one that catches double counting. If Google claims $80,000, Meta claims $60,000, and the store actually did $110,000, then $30,000 of claimed revenue exists in two places at once.
3. Margin-based ROAS, sometimes called POAS. Gross profit from advertising divided by ad spend. Formula: (revenue x contribution margin) / ad spend. A 4x ROAS at a 30% margin is a 1.2x return on profit. This is the version that tells you whether scaling the ad campaign makes the business money, and it is the version most dashboards will not calculate for you because they do not know your cost of goods sold.
4. Incremental ROAS. Revenue that would not have happened without the ads, divided by ad spend. Formula: (revenue with ads minus baseline revenue) / ad spend. It is the honest number and the hardest to produce, because it needs a holdout test or a geo experiment rather than a report. Branded search is where the gap usually shows: an 18x reported ROAS on your own brand name often has a low single-digit incremental ROAS behind it, because most of those buyers were coming anyway.
Pick the version that matches the decision. Optimizing an ad group is a job for platform-reported ROAS. Deciding next quarter's budget allocation is a job for blended and margin-based. Deciding whether a channel deserves to exist is a job for incremental.
Why you cannot add Google ROAS and Meta ROAS together
Summing platform figures is the most common ROAS calculation error, and it fails for a reason that has nothing to do with arithmetic. The two platforms are not measuring the same event over the same window on the same date.
Google Ads credits conversion value using data-driven attribution and reports it against the date of the click, not the date of the sale. Change your attribution model and the same historical period produces different conversion values.
Meta changed its definition twice in 2026. On 12 January the 7-day view and 28-day view windows were removed from Ads Manager and from the Insights API, and a new engaged-through window was introduced, making the default 7-day click, 1-day engaged-through, 1-day view. Advertisers who had been reporting on the longer view windows saw reported conversions fall sharply overnight without anything changing in their accounts. On 3 March, click-through was narrowed again so that only link clicks count, which means likes, saves, shares, comments and image expansions no longer register as clicks and moved into the engaged-through bucket instead.
Two consequences follow, and both are easy to miss. First, a Meta ROAS figure from 2026 is not comparable to a Meta ROAS figure from 2025, because the numerator is built from a different set of events. Any year-over-year ROAS chart that crosses January 2026 is measuring a definition change as if it were performance. Second, adding a Google ROAS to a Meta ROAS produces a number that describes nothing, since the inputs count different actions across different windows anchored to different dates.
The fix is not a better attribution model. It is a second metric. Keep platform-reported ROAS for optimization inside each channel, and run blended ROAS or marketing efficiency ratio on top for the cross-channel view. Our Google Ads management work is built around that split, because a single dashboard number that nobody can reconcile is worse than two numbers that each mean something.
The target ROAS trap: a ratio in one field, a percentage in the other
This one is worth its own section because it is a live formula error with a real cost attached.
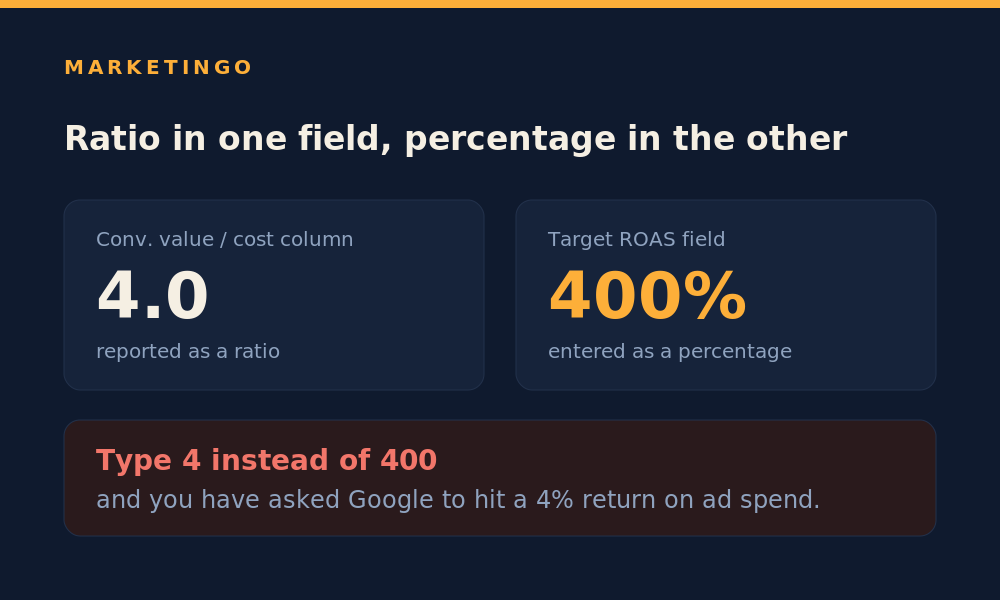
Google Ads reports your historical ROAS in the Conv. value / cost column as a ratio. A campaign returning four dollars per dollar shows 4.0 there.
The target ROAS bidding field takes a percentage. Google's own help documentation spells out the conversion: take the Conv. value / cost figure and multiply it by 100 to get the target ROAS percent. Google's worked example is explicit, $5 in sales divided by $1 in ad spend times 100% equals a 500% target ROAS.
Type 4 into that field instead of 400 and you have asked Google to hit a 4% return on ad spend. The bid strategy will do exactly that: bid aggressively, spend the budget, and optimize toward a target it can clear a hundred times over. The account does not error. It just performs terribly for a reason nobody can see in the reporting.
Two related notes for anyone setting targets this year. Google is relabelling its bid strategies from June 2026, with "Maximize conversion value with a Target ROAS" becoming simply "Target ROAS" while the bidding behaviour stays the same. And from 17 August 2026 Google is changing how target-based bid strategies handle budget-limited campaigns, which the documentation warns may cause temporary fluctuations in performance and traffic. If your ROAS moves in the next few weeks and nothing in the account changed, check the release notes before you rebuild the campaign. Working through an account audit is usually faster than guessing.
ROAS, ROI and ACoS in one table
ROI and ROAS get used interchangeably in conversation, along with ACoS, and none of the three is the same calculation.
| Metric | Formula | What it measures | When to use it |
|---|---|---|---|
| ROAS | revenue / ad spend | Revenue returned per dollar of ad spend | Comparing campaigns, setting bid targets |
| ROI | (gross profit minus ad spend) / ad spend | Return on investment after costs, as a net figure | Board reporting, channel-level profitability |
| ACoS | ad spend / revenue | Ad spend as a share of the revenue it produced | Marketplace advertising, Amazon in particular |
| POAS | (revenue x margin) / ad spend | Profit returned per dollar of ad spend | Deciding whether to scale spend |
The ROAS and ROI distinction is the one worth internalising. ROAS is a gross ratio built on revenue. Return on investment is a net figure built on profit, and it subtracts the ad spend from the return before dividing. A campaign at 4x ROAS with a 30% contribution margin produces $1.20 of gross profit per dollar spent, which is a 20% ROI. Same campaign, same data, and one number looks four times better than the other because they are answering different questions about profitability.
If your finance team asks for return on investment and you hand them ROAS, expect the conversation to go badly.
Break-even ROAS: the version that sets your target
The formula that turns ROAS from a score into a decision is this one:
Break-even ROAS = 1 / contribution margin
At a 25% margin you break even at 4x. At a 40% margin you break even at 2.5x. At a 60% margin you break even at 1.67x. Anything above the line is profit and anything below it is a subsidy.
This is also the honest answer to the most repeated claim in the category, that 4:1 is the standard ROAS benchmark. Nobody who quotes 4:1 tends to cite a source for it, and the reason is that it is not a research finding. It is arithmetic. Four is exactly break-even at a 25% contribution margin, which was a reasonable assumption for a mid-margin retailer, and the number outlived the assumption behind it. If your margin is 45%, a 4x target is asking your ads to clear a bar nearly double the one your business actually needs, and you will underspend into growth you could have bought. If your margin is 18%, 4x loses money on every order.
Run your own figure before you adopt anyone's benchmark. The ecommerce ROAS calculator does the break-even math against your margin, and the lead generation ROI calculator does the equivalent for a B2B funnel where the revenue arrives months after the click. Both sit on the resources hub with the rest of the profit math.
What actually moves the ROAS ratio
Once the formula is right, it helps to see what sits underneath it. Return on advertising spend decomposes into three inputs:
ROAS = (conversion rate x average order value) / cost per click
Multiply a 2.5% conversion rate by a $120 average order value and you earn $3 of revenue per click. Divide that by a $1.20 cost per click and the ROAS is 2.5. Every lever you have pulls on one of those three terms, which is why calculating your ROAS correctly matters less than knowing which input is dragging.
A low ROAS is almost never a mystery once you decompose it. Rising cost per click means auction pressure or loose targeting. A falling conversion rate usually means the landing page or the offer, not the ad. A shrinking average order value points at discounting or a shift in product mix. Reading the three separately turns a vague marketing strategy conversation into a specific one, and it tells you whether the fix belongs to media, to the site, or to merchandising. That is also the point where a ROAS figure starts informing your advertising strategy rather than just grading last month's marketing efforts.
Two extensions are worth knowing. For subscription and repeat-purchase businesses, first-order ROAS understates the return badly, because customer lifetime value arrives over months while the ad costs land today. Those advertisers set ROAS targets against expected lifetime value rather than the first transaction, which is why a paid ads programme can run below first-order break-even on purpose. And for anyone tracking ROAS across several ad platforms, the minimum ROAS you accept on a prospecting campaign should be lower than the one you accept on retargeting, since the two are buying different things. A single account-wide minimum ROAS flattens that distinction and quietly starves the top of the funnel. This is the same decomposition our ecommerce and DTC work runs on, and it is what separates a digital marketing dashboard from a decision.
Common mistakes when calculating ROAS
A short list of what goes wrong most often, in rough order of how much money it costs.
- Using gross checkout revenue. Returns, discounts and cancellations have not been removed. Net the numerator down before you make a decision on it.
- Counting media spend only. Management fees, creative and tooling are advertising costs. Leave them out and every channel looks better than it is.
- Adding platform ROAS figures together. Different attribution windows, different credited events, different dates. The sum is meaningless.
- Comparing periods across an attribution change. Both Google and Meta have changed how value is credited in 2026. Annotate the date on the chart.
- Entering a ratio in the target ROAS field. 4 is not 400. Check the field before you save.
- Reading ROAS without the margin beside it. The ratio cannot tell you whether you made money. Only the contribution margin can.
- Judging a campaign before the conversion delay has passed. Google's guidance is to exclude the most recent conversion window from any ROAS evaluation, because late-arriving conversions will lift it after the fact.
- Chasing a higher ratio by cutting spend. Narrowing to the safest clicks raises ROAS and shrinks the business. Maximum ratio and maximum profit are rarely the same point.
Where MarketinGO fits
MarketinGO is a paid media agency for US and European clients, running Google, Meta, LinkedIn and Microsoft Ads for DTC ecommerce brands and high-ticket B2B lead generation. Senior operators run the accounts, and campaigns typically go live within about a week.
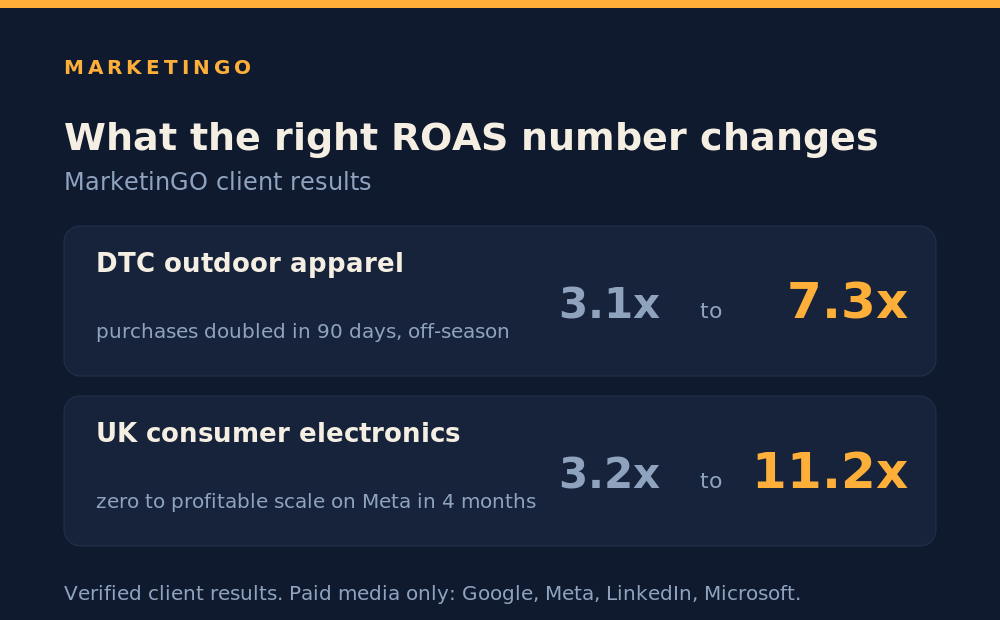
The reporting philosophy is the argument this article makes. Every account gets a platform figure for optimization and a blended, margin-aware figure for the business decision, with the break-even line stated up front so nobody is guessing whether a number is good. That is how an outdoor apparel brand went from 3.1 to 7.3 ROAS with purchases doubling inside 90 days, in the off-season, and how a UK consumer electronics brand went from 3.2 to 11.2 on Meta in four months. The fashion ecommerce case study walks through the levers used in the first of those.
If your ROAS number and your bank balance are telling different stories, a free ad audit will show you which inputs are wrong and where the reported figure is flattering the account.