Break-even ROAS is the return on ad spend at which a campaign stops losing money and has not yet started making any. Above it you are buying profit. Below it you are buying revenue with your own margin.
Break-even ROAS = 1 ÷ contribution margin
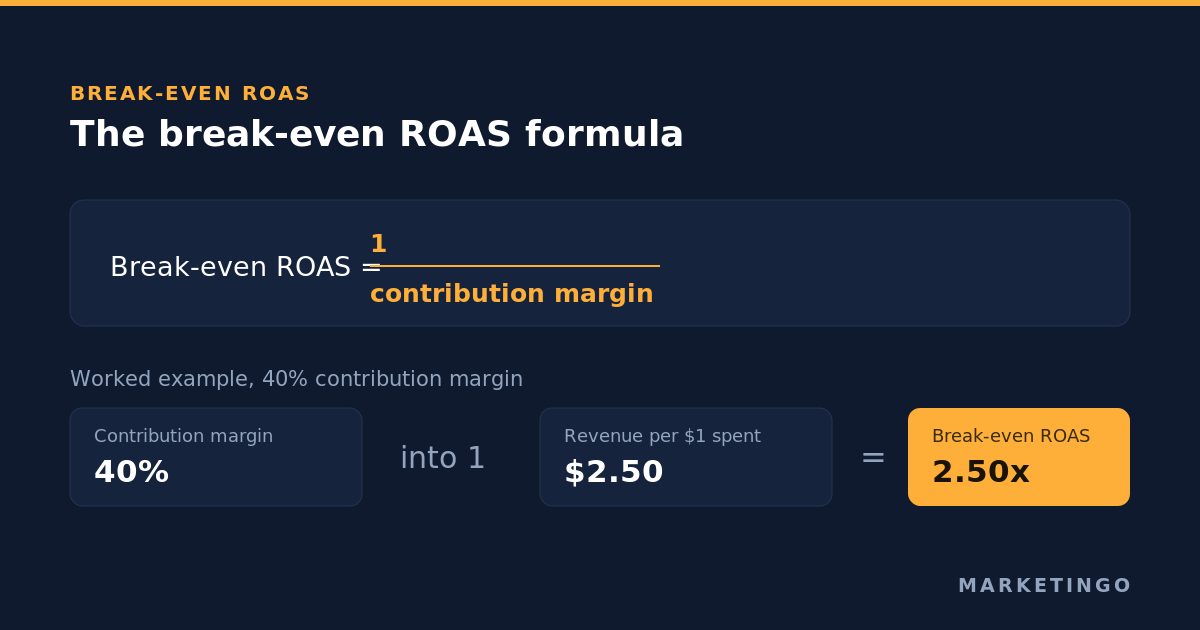
A product with a 40% contribution margin has a break-even ROAS of 2.5x, or 250% in the way ad platforms express it. Every dollar spent on advertising has to bring back $2.50 in revenue before the ads pay for themselves.
That much is uncontroversial, and it is where almost every article on the subject stops. The problem is the input. Type "break-even ROAS" into Google and the tools that rank will ask you for your gross margin, then hand back 1 divided by it. Gross margin is not contribution margin, the gap between them is large, and on a normal store that single substitution understates the real break-even point by more than 80%.
The break-even ROAS formula
Return on ad spend is revenue divided by ad spend, so the break-even point is the ROAS at which contribution profit exactly equals what you paid for the traffic.
Break-even ROAS = 1 ÷ contribution margin
Contribution margin is the share of each order's revenue that survives every variable cost of fulfilling that order, before advertising. Not gross margin, which stops at cost of goods sold (COGS). Everything that scales with volume belongs in it: payment processing, pick and pack, outbound shipping, and the cost of the orders that come back.
You will meet the metric written three ways, as break-even ROAS, as break even ROAS without the hyphen, and as breakeven ROAS, and shortened to BEROAS inside Shopify-adjacent tools. They all name the same minimum ROAS an ad campaign has to hold, and the spelling only matters when you are hunting for a calculator.
The reference table below is the formula applied across the range most advertisers sit in. Read it with contribution margin, not gross margin, or it will flatter you.
| Contribution margin | Break-even ROAS | Expressed as a percentage |
|---|---|---|
| 20% | 5.00x | 500% |
| 25% | 4.00x | 400% |
| 30% | 3.33x | 333% |
| 35% | 2.86x | 286% |
| 40% | 2.50x | 250% |
| 45% | 2.22x | 222% |
| 50% | 2.00x | 200% |
| 60% | 1.67x | 167% |
| 70% | 1.43x | 143% |
| 80% | 1.25x | 125% |
Two things fall out of that table immediately. The relationship is not linear, so the same 5 point improvement in margin is worth far more at the thin end than at the fat end. And the widely traded rule of thumb that "3x ROAS is roughly break-even" is only true for a business with a 33% contribution margin. For a software company at 80% it is nonsense, and for a low-margin reseller at 20% it is a fast route to insolvency.
Why the standard break-even ROAS formula understates the number
Here is the same store, calculated three ways. Average order value of $80, cost of goods sold of $28, which is a 65% gross margin, the kind of margin a direct-to-consumer brand is built on.
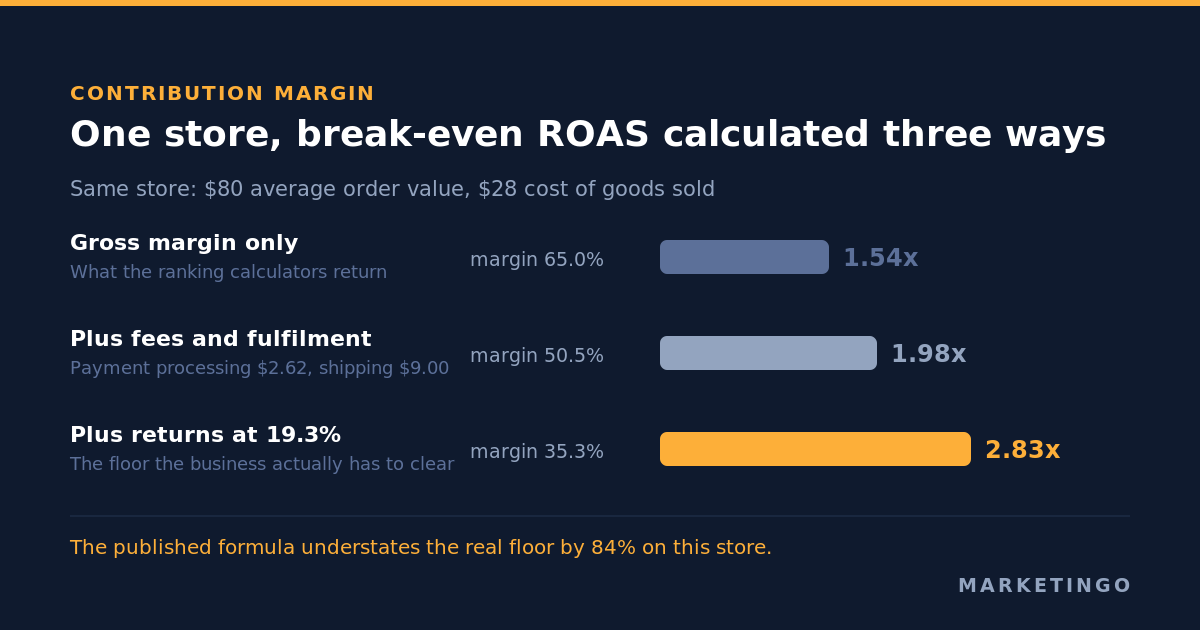
Version one, gross margin only. 1 ÷ 0.65 = 1.54x. This is the number the ranking calculators return, and it is wrong in a specific direction: it treats every dollar of gross profit as if it were available to pay for advertising.
Version two, add the costs of actually shipping the order. Payment processing at 2.9% plus $0.30 is $2.62 on an $80 order, and transaction fees of that shape do not shrink as volume grows. Pick, pack and outbound shipping costs another $9.00. Contribution per order falls to $40.38, a 50.5% margin, and the break-even ROAS rises to 1.98x.
Version three, add returns. This is the step almost nobody takes, and it is the largest of the three.
| Line item | 1,000 orders at $80 |
|---|---|
| Reported revenue | $80,000 |
| Refunds on returned orders (19.3%) | ($15,440) |
| Cost of goods sold on the 807 orders kept | ($22,596) |
| Payment processing, all 1,000 orders | ($2,620) |
| Pick, pack and outbound shipping, all 1,000 orders | ($9,000) |
| Reverse logistics and restocking on 193 returns | ($2,123) |
| Contribution before ad spend | $28,221 |
| Contribution margin on reported revenue | 35.3% |
| Break-even ROAS | 2.83x |
The floor moved from 1.54x to 2.83x on the same store, with no change to the product cost and no change to the selling price. A store bidding to a 2.5x target because it believes break-even sits at 1.54x is not comfortably profitable. At a 35.3% contribution margin it loses about 12 cents on every dollar of ad spend, and it loses more of them the harder it scales.
The table assumes returned goods come back saleable and get restocked, which is generous. Damaged and unsaleable returns push the real number higher still.
Returns, the input most break-even ROAS calculators leave out
The 19.3% used above is not a placeholder. In the 2025 Retail Returns Landscape, the National Retail Federation and Happy Returns report that retailers expect 19.3% of online sales to be returned in 2025, against 15.8% of total retail sales, worth $849.9 billion across the industry. The overall rate held roughly steady against 16.9% in 2024, so this is a structural cost of selling online rather than a spike to wait out.
The figure comes from a survey of 358 e-commerce professionals at US retailers with over $500 million in revenue, so it describes large merchants rather than the whole market, and a small brand should still measure its own rate.
Two details in that report change the arithmetic further. Return fraud accounts for 9% of all returns, and those units usually do not come back saleable. And retailers expect 17% of holiday sales to be returned, which means the break-even ROAS you calculate in November is not the one that applies to what you sell in November.
The practical consequence is that a single annual break-even ROAS is too blunt for a catalogue with mixed return behaviour. Apparel returns at multiples of the rate for consumables, and a category-level figure is worth the afternoon it takes to build. If one collection returns at 35% and another at 6%, they do not share a break-even point and they should not share a bid target.
How to calculate your break-even ROAS in five minutes
Every free breakeven ROAS calculator asks for the same handful of inputs, so the work is not the arithmetic. A calculator will do the division. It cannot tell you whether the margin you typed into it was honest, and that is the part that goes wrong. Five figures, in this order, and you will know your break-even ROAS for real rather than the flattering version.
1. Average order value. Store platform, last 90 days, merchandise revenue only. Exclude shipping charged to the customer and exclude tax, because neither is yours to keep.
2. Cost of goods sold. The landed cost of what is in the box, including inbound freight and duty. Write it as a percentage of that order value. This is the only input the typical free break even ROAS calculator asks for, which is exactly why its answer is too low.
3. Variable fulfilment cost per order. Payment processing, pick and pack, packaging, and whatever you subsidise on outbound delivery.
4. Return rate and cost per return. Pull the rate from your own refund data rather than an industry average, then price a single return: reverse shipping, inspection, restocking, and the value of anything that comes back unsaleable.
5. Contribution margin. Subtract items two, three and four from item one, then divide by item one. One divided by that percentage sets the floor.
Two rules keep the result honest. Use the same revenue definition throughout, and calculate the break-even ROAS per product group rather than once for the whole catalogue. An advertising campaign selling a 70% margin accessory and one selling a 22% margin appliance do not share a break-even point, and averaging them produces a figure that is wrong for both.
The output is worth more than a single number on a spreadsheet. Knowing your break-even ROAS tells you three things at once: whether each campaign is generating enough revenue to cover what it cost, how much room you have to scale before profit disappears, and which products should never have been advertised at all. Without it, a high ROAS is just a number with no verdict attached, and a campaign returning 4x might be your best performer or your worst depending on what it is selling.
The same arithmetic decides whether Google, Meta, Microsoft, TikTok Ads or Snapchat ads are profitable. Only the interface changes. Once you know the exact ROAS your ads have to clear, you can optimize your advertising against a real return on investment rather than against whichever campaign happens to look busiest this week.
From break-even ROAS to a target ROAS you can bid to
Break-even is a floor, not a goal. Nobody runs advertising to arrive exactly at zero. The target you actually bid to is the one that leaves the profit you need after the traffic is paid for.
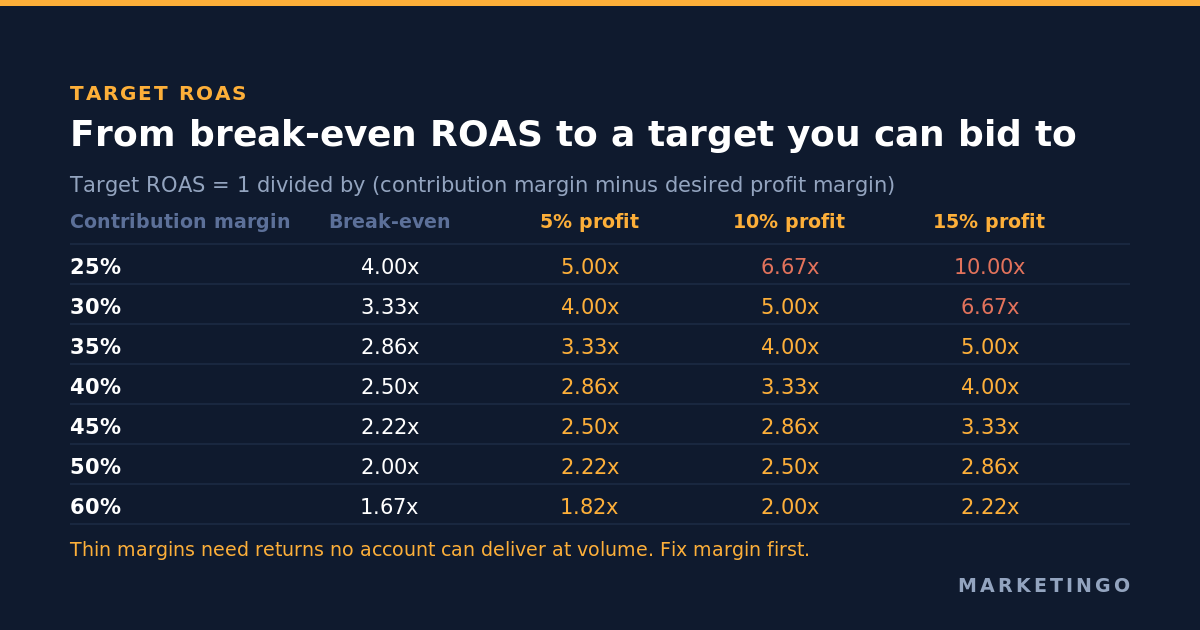
Target ROAS = 1 ÷ (contribution margin − desired profit margin)
Both figures are expressed as a share of revenue. The table below runs that calculation across the usual range, with each column showing the return on ad spend needed to keep that much of revenue as profit after advertising.
| Contribution margin | Break-even | For 5% profit | For 10% profit | For 15% profit |
|---|---|---|---|---|
| 25% | 4.00x | 5.00x | 6.67x | 10.00x |
| 30% | 3.33x | 4.00x | 5.00x | 6.67x |
| 35% | 2.86x | 3.33x | 4.00x | 5.00x |
| 40% | 2.50x | 2.86x | 3.33x | 4.00x |
| 45% | 2.22x | 2.50x | 2.86x | 3.33x |
| 50% | 2.00x | 2.22x | 2.50x | 2.86x |
| 60% | 1.67x | 1.82x | 2.00x | 2.22x |
The columns get steep fast at the thin end, and that steepness is the whole argument for fixing margin before touching bids. A business at 25% contribution margin needs a 10x return to hold 15% profit, which no amount of campaign work will produce at volume. A business at 50% needs 2.86x for the same result. Margin work is usually the cheaper lever, and it is the one media buying cannot substitute for.
The gap between the break-even column and the target you choose is also your tolerance for being wrong. Conversion tracking drifts, attribution windows shift, a supplier raises prices. Bidding to a target one or two tenths above break-even means any of those turns the account unprofitable before anyone notices.
Setting target ROAS in Google Ads
Google Ads takes the target as a percentage rather than a multiple, so a 3.33x target is entered as 333%. Google's Target ROAS documentation sets out the conversion the platform expects: "$5 USD in sales ÷ $1 USD in ad spend x 100% = 500% target ROAS."
Three things in that documentation are worth acting on.
The strategy hits an average, not a floor. Google states that "some conversions may return a higher ROAS and some may return a lower ROAS, but altogether Google Ads will try to keep your conversion value per cost equal to the target ROAS you set." A target set at break-even therefore produces roughly half your conversions below break-even. The target belongs above the floor, not on it.
There is a data minimum. Search and Shopping campaigns need at least 15 conversions in the previous 30 days before the strategy has anything to learn from. Below that, a target ROAS campaign is guessing with your budget.
Too high a target starves the campaign. Google's own guidance warns that "setting a target that's too high may limit the amount of traffic your ads may get." The failure mode is quiet: spend collapses, the reported return looks excellent, and the business grows less than it did.
Google is also changing how these strategies behave. From 17 August 2026 it is updating its bidding systems for campaigns limited by budget, which it says may cause temporary performance and traffic fluctuations for campaigns using Target CPA or Target ROAS, and it released a Bid Target Adjustment Tool in July 2026 to help re-set targets. If an account's returns moved in late August 2026, that is the first thing to rule out before rewriting the ads. The same arithmetic applies whatever you are buying on, whether that is Google, Meta, Microsoft or TikTok. Only the field you type the number into changes.
Real ROAS versus the ROAS your platform reports
A break-even ROAS is only meaningful against a ROAS measured the same way, and this is where most accounts quietly break.
Google Ads and Meta Platforms both report ad revenue from the conversion value your own tracking sends them, and that value is usually gross order value at checkout. Depending on configuration it can include shipping charged to the customer and sales tax, and it never includes the refund issued three weeks later. The break-even ROAS calculated above is expressed against that same reported revenue, which is why the returns cost sits in the contribution line rather than being deducted from the top. Mix the two conventions, comparing a platform-reported ROAS against a break-even calculated on net revenue, and the account will look profitable while the bank balance disagrees.
The second mismatch is scope. Platform-reported ROAS covers only what that platform claims credit for. Blended ROAS, total revenue over total ad spend, covers the business. The two diverge most exactly when you are scaling, which is when the decision matters. Marketing efficiency ratio is the metric built for that job, and the sensible split is to hold campaign-level targets against a platform-reported break-even while judging the month on the blended number.
The third is the customer, not the order. A break-even ROAS calculated on first orders treats a new customer as a single transaction. If repeat purchase behaviour is real and measured, the first order can run below the single-order break-even and still be a good buy on customer lifetime value, which analytics tools often label CLV, and that is the argument the LTV to CAC ratio exists to settle. That licence is only valid with cohort evidence behind it. Assumed lifetime value has funded a great deal of unprofitable scaling.
How to lower your break-even ROAS
Because the metric is one over contribution margin, every point of margin recovered lowers the bar the media has to clear. Four levers do most of the work.
Raise average order value. Fixed per-order costs stop mattering as much when the order is bigger, which is why average order value (AOV) usually does more for profitability than any bid change. On the store above, moving from $80 to $110 while holding the same 35% cost of goods takes the break-even ROAS from 2.83x to about 2.43x, because $9 of shipping and a flat payment fee are spread over more revenue.
Cut the return rate. Better size guidance, honest photography and accurate specifications are advertising work as much as merchandising work. Each point off the return rate goes straight into contribution.
Renegotiate shipping and processing. These are the least glamorous line items and the most reliably negotiable, particularly once volume has grown past whatever tier the current rates were set at.
Stop advertising the products that cannot clear the bar. This one belongs to the media team. A catalogue always contains items whose contribution margin makes them unadvertisable at any realistic return, and shopping campaigns will happily spend on them for months. For a dental supplies retailer running roughly 40,000 products, MarketinGO found 37% of budget going to items generating no revenue at all, and removing that spend lifted blended Google ROAS from 7.86 to about 8.5 while spend was still scaling. Nothing about the bidding changed. The money simply stopped going to products that could never pay it back.
Better creative and tighter targeting raise the ROAS your advertising efforts achieve. Only margin work lowers the number they have to clear, and the second is permanent.
The lead generation version: break-even cost per lead
Break-even ROAS assumes revenue arrives with the conversion. In business-to-business lead generation it does not, so the equivalent calculation runs on cost per lead.
Break-even cost per lead = gross profit per closed deal × lead-to-customer rate
A company that makes $9,000 of gross profit on an average contract and closes 6% of the leads it generates can pay up to $540 per lead before the Google Ads campaign stops paying for itself. The structure is identical to the break-even ROAS calculation, with the close rate doing the work that contribution margin does for a store.
The differences are in the error bars. The close rate is a trailing average across a sales team, it varies by lead source, and the deal that justifies today's spend may close two quarters from now. That lag is why lead generation accounts should be judged on a rolling cohort rather than a calendar month, and why the break-even figure needs recalculating whenever the sales team's conversion rate moves. The lead generation ROI calculator runs the same arithmetic on your own numbers.
Check your break-even ROAS against your actual account
Most accounts we audit are bidding to a target that was set once, from a gross margin, before the current shipping rates and the current return rate existed. The number is usually too low, and the campaigns are usually being praised for hitting it.
A free ad audit rebuilds the number from your real contribution margin and shows you which campaigns and products are clearing it. For ecommerce and direct-to-consumer brands that is normally where the profitable scaling has been hiding: one outdoor apparel brand moved from 3.1x to 7.3x return on ad spend with purchases doubling in 90 days, in its off-season, once the spend was pointed at what actually cleared the bar. You can run the store-side arithmetic yourself first with the ecommerce ROAS calculator, and the companion pieces on the ROAS formula and what a good ROAS looks like cover the calculation and the benchmarks in more depth.