The LTV to CAC ratio divides the lifetime value of a customer by the cost of acquiring one. A customer worth $2,400 in gross profit acquired for $600 gives you a ratio of 4:1.
That is the whole calculation, and it is why the metric spread so fast. One division, one number, and an apparently clear verdict on whether your growth is worth funding.
The trouble starts one level down. Customer acquisition cost is measurable this quarter. Lifetime value is a forecast about customers who have not churned yet, and the ratio inherits every assumption inside it. Worse, the two halves are not independent. Buy more customers and your cost of acquiring them rises, which is precisely the situation a healthy ratio is used to justify.
This article covers how to calculate the LTV to CAC ratio properly, what the 3:1 rule says in the source everybody cites and nobody reads, and the two things you should track alongside it.
The LTV to CAC ratio formula
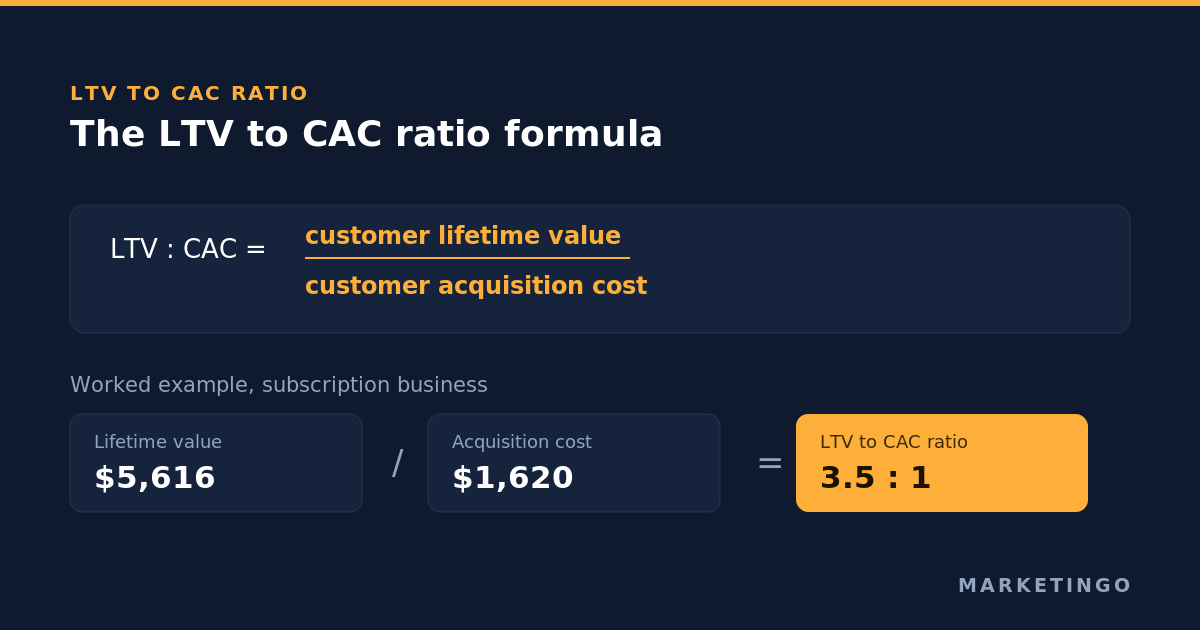
LTV to CAC ratio = customer lifetime value ÷ customer acquisition cost
Both inputs must cover the same customer population and the same definition of value. The result is conventionally written as a ratio against 1, so a lifetime value of $2,400 against an acquisition cost of $600 is expressed as 4:1 rather than as 4. You will see the metric written as the LTV:CAC ratio, the LTV-CAC ratio or the LTV-to-CAC ratio, and occasionally inverted as a CAC to LTV ratio, which is the same relationship read the other way round. They are all the same calculation.
| Input | Value |
|---|---|
| Average revenue per account, monthly (also called average revenue per user) | $180 |
| Gross margin | 78% |
| Monthly gross profit per account | $140.40 |
| Monthly customer churn rate | 2.5% |
| Average customer lifetime (1 ÷ churn) | 40 months |
| Customer lifetime value | $5,616 |
| Customer acquisition cost | $1,620 |
| LTV to CAC ratio | 3.5:1 |
Read that table once more and notice how much of the output depends on one input. The churn rate sets the customer lifetime, the lifetime sets the value, and the value sets the ratio. Move monthly churn from 2.5% to 3.5% and the lifetime falls from 40 months to about 29, the lifetime value falls to roughly $4,011, and the ratio drops to 2.5:1. Nothing about the marketing changed.
How to calculate LTV, which is the hard half
Customer acquisition cost is arithmetic on numbers you already have. Lifetime value is a model, and most of the disagreement about the LTV to CAC ratio is really disagreement about how lifetime value was built.
Bill Gurley of Benchmark, writing about the formula in 2012, defines it precisely: lifetime value is "the net present value of the profit stream of a customer." Three words in that sentence do the work.
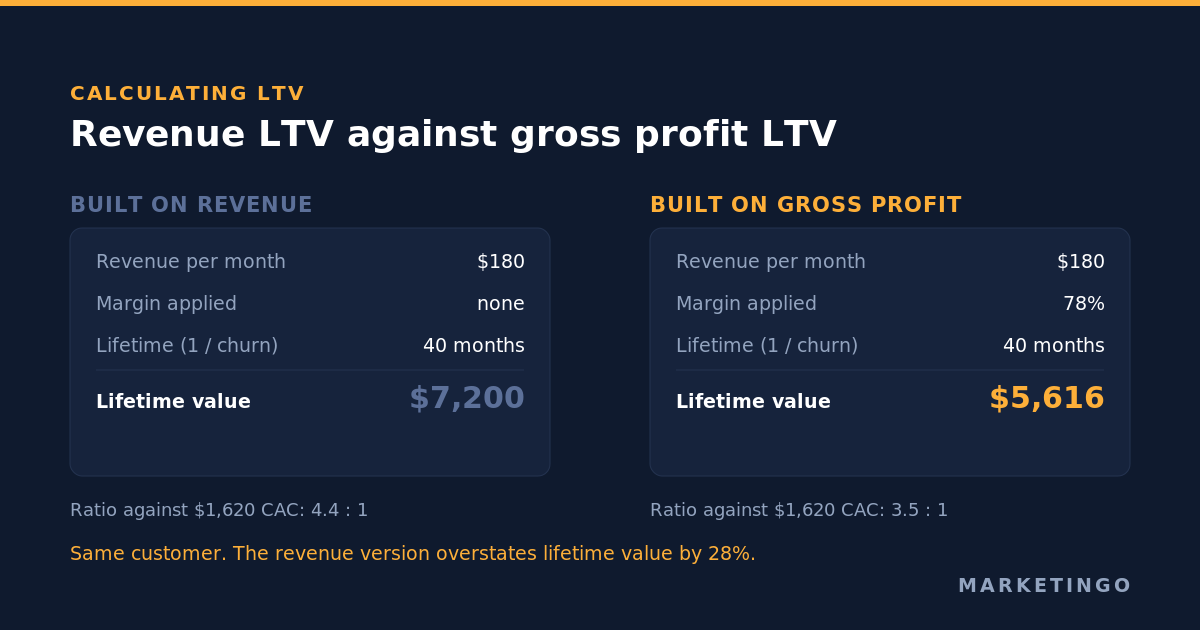
Profit, not revenue. The most common error in the numerator is running lifetime value on revenue. Gurley names it directly: many people "discount 'revenues' rather than marginal cash contribution," and he argues it is critical to bundle all future variable costs of supporting the customer in order to fairly estimate future contribution. On a 78% margin, running lifetime value on revenue overstates it by 28%. On a physical product at 35%, revenue lifetime value overstates the real number by nearly three times, and a ratio built on it will happily approve spending that loses money on every order.
Net present value, not a raw sum. Money arriving in month 36 is worth less than money arriving now. Most operating teams skip the discount, which is defensible for short lifetimes and indefensible for the multi-year forecasts where it matters most.
Of a customer, which means the population has to be defined. For a subscription business the workable formula is:
LTV = (average revenue per account × gross margin %) ÷ customer churn rate
For a business without recurring revenue, average customer lifetime is not the inverse of a subscription churn rate, so the substitute is repeat purchase behaviour observed in cohorts:
LTV = average order value × gross margin % × expected number of orders per customer
The honest version of that second formula uses orders you have actually observed from a cohort old enough to have finished buying, not a projection. A cohort analysis of customers acquired twelve or twenty-four months ago tells you what a customer is worth. A model tells you what you hope one is worth.
If you have not yet settled the denominator, the companion piece on customer acquisition cost covers why ad platform cost per acquisition is usually not customer acquisition cost, which is the single most common reason a ratio comes out flattering.
Where the 3:1 rule actually came from
Almost every article on this metric asserts that a good LTV to CAC ratio is 3:1. The rule has a real source, which is more than most marketing conventions manage: David Skok's SaaS Metrics 2.0.
What the source says is more careful than the rule it turned into. Skok writes that "the best SaaS businesses have a LTV to CAC ratio that is higher than 3, sometimes as high as 7 or 8," and that "many of the best SaaS businesses are able to recover their CAC in 5-7 months." He adds that "many healthy SaaS businesses don't meet the guidelines in the early days," and closes the section by stressing that "these are only guidelines, there are always situations where it makes sense to break them."
Three things get lost between that page and the version repeated everywhere.
It is a description of observed outcomes at strong companies, not a target to manage toward. A ratio is an output. You cannot instruct a team to produce a 3:1 ratio the way you can instruct them to hold a cost per lead.
It was written for venture-funded B2B SaaS with recurring revenue, multi-year lifetimes and a measurable customer churn rate. Applied to a single-purchase product, or to a company with nine months of history and no cohort old enough to measure, the arithmetic is performed on a guess.
And the upper bound is routinely misquoted in both directions. Skok observed the best businesses running as high as 7 or 8, so a high ratio is not automatically evidence of underinvestment. It is evidence of one of two things, and the next section is about telling them apart.
What is a good LTV to CAC ratio?
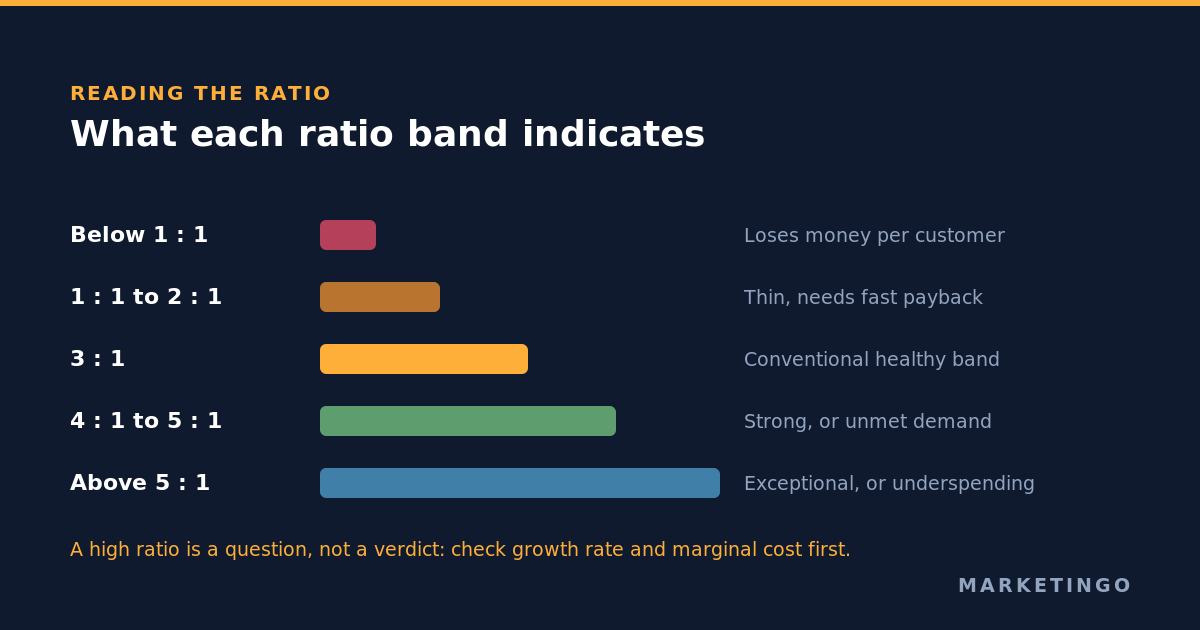
The ratio bands below are how most investors and operators read the number. Treat them as a starting interpretation rather than a verdict, because the same ratio means different things at different growth rates.
| Ratio | Usual reading | What to check first |
|---|---|---|
| Below 1:1 | Losing money on every customer acquired | Whether lifetime value is built on gross profit or revenue |
| 1:1 to 2:1 | Thin. Viable only with very fast payback or strong expansion revenue | CAC payback period, net revenue retention |
| 3:1 | The conventional healthy band | That churn is measured, not assumed |
| 4:1 to 5:1 | Strong unit economics, or unexploited demand | Growth rate against market share |
| Above 5:1 | Either exceptional economics or genuine underspending | Whether more volume is available at an acceptable marginal cost |
That last row is where the useful judgement sits. A business at 8:1 is either running the kind of economics Skok saw at the best SaaS companies, or leaving profitable acquisition unbought while a competitor at 3:1 takes the market. Two questions separate the cases. Is the business growing at or above its market? And when you last increased spend, what did the marginal cost of the next customer do? Exceptional economics survive more volume. Underspending is what you call it when cheap demand is sitting there unbought.
A ratio also cannot be compared across companies without checking the definitions underneath it. One company's fully loaded acquisition cost including salaries against another's media-only figure is not a comparison, and neither is gross margin lifetime value against revenue lifetime value. Most published benchmark tables for this metric quietly mix all four.
CAC payback period, the number that needs no forecast
The sturdier companion metric requires no view about churn three years out.
CAC payback period = customer acquisition cost ÷ monthly gross profit per customer
A customer costing $1,620 who contributes $140.40 of gross profit a month pays back in about 11.5 months. That is a fact about money you have already seen, not a forecast, which is exactly why it holds up when lifetime value does not. Skok's own second guideline is built on it: profitability, he writes, "is anemic if the time to recover CAC extends beyond 12 months."
| Monthly revenue per customer | At 40% margin | At 60% margin | At 80% margin |
|---|---|---|---|
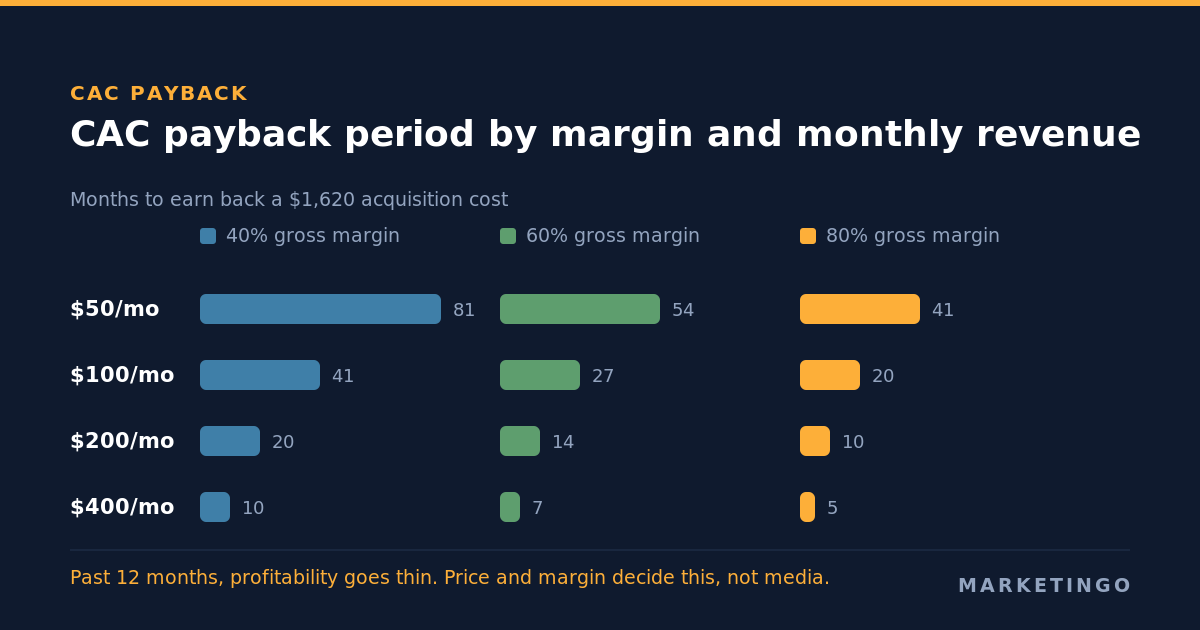
| $50 | 81 months | 54 months | 41 months |
| $100 | 41 months | 27 months | 20 months |
| $200 | 20 months | 14 months | 10 months |
| $400 | 10 months | 7 months | 5 months |
Every cell assumes the same $1,620 acquisition cost, which is the point of the table. Margin and price decide whether that cost is affordable, and no amount of media optimisation compensates for a business model where the payback runs past four years.
Payback period also carries the cash constraint that the ratio hides. A 5:1 ratio with a 30-month payback describes a business that is profitable eventually and out of cash meanwhile. Growth is funded from the cash customers return, so how long they take to return it sets how fast you can spend.
Why the ratio decays as you scale
This is the part that matters most to anyone actually buying media, and it is the part the formula conceals.
Gurley's central objection is that the variables are not independent. He credits Tren Griffin with the image of the five variables as horses roped together and facing different directions, so that when one pulls, the others find it harder to move. The mechanics he describes are specific: raise price and churn rises with it; spend more to grow faster and acquisition cost rises, because the supply of buyable customers is finite; and a more aggressive acquisition programme tends to capture lower quality customers, which raises churn again from the other side.
Follow that through and a single quarter's ratio stops looking like a property of the business. It is a property of the business at that spend level. Gurley works the arithmetic in his sixth objection: a company planning to quadruple marketing spend over three years is assuming its acquisition cost falls while it tries to buy four times as much of a finite good, and supply and demand suggest the opposite.
He makes one further point that anyone reporting a blended ratio should sit with. Marketers, he writes, "often divide spend by total customers to calculate SAC rather than just those customers that were 'purchased'," and organic customers "would have arrived regardless of spend." Put organic customers in the denominator of acquisition cost and you get a lower cost, a higher ratio, and a decision to spend more that the data never actually supported. He also argues that purchased customers underperform organic ones on conversion rate, churn and satisfaction, which means a blended lifetime value applied to paid customers overstates them too. The error compounds in both halves of the ratio, in the same direction.
The practical consequence: read the ratio at the margin, not on average. The question that decides next month's budget is what the next $10,000 of spend produces, not what the last $200,000 produced on average. Those two numbers diverge exactly when you are scaling, which is when you most want to trust the ratio. This is the same argument that makes marketing efficiency ratio more useful than a platform-reported return figure once several channels are running at once.
Calculate the ratio by segment, not as one company average
A single company-wide ratio averages away the decision it is supposed to inform. Run it per segment and the picture usually reorganises itself.
The clearest published example comes from HubSpot, whose Brad Coffey describes the exercise in Skok's article. When HubSpot segmented, they found an LTV to CAC ratio of 1.5 selling direct into the very small business market and a ratio of 5 selling through value added resellers. They had 12 reps selling direct and 4 through the channel. Twelve months later they had flipped it to 2 direct and 25 through the channel. As Coffey puts it, the solution was obvious once the math was visible, and it was invisible in the blended number.
The paid media equivalent runs by channel and campaign type:
| Segment | Acquisition cost | Lifetime value | Ratio |
|---|---|---|---|
| Branded search | $310 | $5,616 | 18.1:1 |
| Non-brand search | $1,480 | $5,616 | 3.8:1 |
| Paid social prospecting | $2,290 | $5,616 | 2.5:1 |
| Blended | $1,620 | $5,616 | 3.5:1 |
Nothing in that account performs at 3.5:1. The branded row is largely harvesting demand the other two rows created, so shifting budget toward it is the most common way an account quietly stops growing. Hold branded and non-brand apart permanently, and where lifetime value genuinely differs by channel, use the segment's own figure rather than the company average. Customers acquired through prospecting frequently churn faster than customers who arrived on a branded search, which makes the gap between those rows wider than the table shows.
What actually moves the ratio in a paid account
Four levers, ordered by how often each turns out to be the binding constraint.
Fix the inputs before optimising anything. Separate new from returning customers, count conversions deliberately rather than accepting platform defaults, and import closed-won data so the platform optimises toward customers instead of form fills. Accounts routinely find their real acquisition cost sits well above what they believed, and every decision taken before that point was taken on the wrong number. A structured Google Ads audit is usually where this surfaces.
Cut spend that produces conversions but not customers. On a dental supplies account with roughly 40,000 SKUs, 37% of budget was going to products that generated no revenue at all, and reallocating it lifted blended Google ROAS from 7.86 to about 8.5 while spend increased.
Buy better customers rather than cheaper leads. For a regulatory compliance company, MarketinGO cut cost per lead from $112 to $40.25, a 64% reduction, and delivered 557 additional high-value leads on $4,000 less spend over six months. For a document redaction software business, restructuring around high-intent search took cost per trial from $64 to about $27 while roughly tripling weekly trial signups. Both moved the acquisition cost half of the ratio by changing what the account was buying.
Then work on the numerator. Lifetime value responds to churn, pricing and expansion revenue rather than to media, which puts most of it outside a paid media account. What paid media controls is which customers enter the cohort in the first place, and that is a larger lever than it sounds: the audiences, keywords and creative that fill the funnel decide the churn profile of everyone in it.
For high-ticket B2B, that usually means LinkedIn Ads running alongside Google Ads with closed-won data flowing back in, so the close rate rather than the form fill sets the bid. For DTC and ecommerce brands, the same discipline runs through margin, which is why the ROAS formula and what counts as a good ROAS are the companion questions on that side. The lead generation ROI calculator will run cost per lead, close rate and deal value together for a B2B model, and the ecommerce ROAS calculator does the equivalent for a DTC one.
Gurley's closing line is the right note to end the theory on. The formula, he writes, is a tool rather than a strategy, and "you can't win a fight with a measuring tape."
How to track and improve the LTV to CAC ratio
A ratio calculated once is a snapshot of a business that has already moved. The tracking method that works is cohort analysis: group customers by the month you acquired them, then follow each cohort's revenue and retention forward, so lifetime value is measured from behaviour rather than assumed. Cohorts also let you track LTV and CAC as a matched pair. The customers acquired in March carry March's acquisition costs, and that is the only comparison that means anything when sales and marketing spend moves month to month.
Set the cadence to the sales cycle. Monthly cohorts for ecommerce, quarterly for most B2B, and no conclusions from a cohort younger than one full purchase cycle. A ratio that improves every month in a fast-growing account is usually a cohort that has not aged yet.
When the ratio is low, the fix depends on which half is responsible, and the two halves respond on completely different timescales. Acquisition cost moves in weeks and is the half a media account controls, using the levers in the section above. Lifetime value moves in quarters, and three things raise it, in roughly the order they pay off.
Customer retention. In a recurring revenue business, churn sets the customer lifetime and lifetime sets the value. A monthly churn rate falling from 3% to 2% stretches the average lifetime from 33 months to 50 and lifts lifetime value by half, with no change to price or to what you spend to acquire new customers. A strong ratio in the SaaS industry almost always has a retention story behind it rather than a marketing one.
Expansion revenue. Upsells, seat growth and price increases applied to the existing base raise annual recurring revenue per account without adding acquisition costs at all. Where expansion outruns churn, net revenue retention passes 100% and lifetime value loses its natural ceiling, which is the mechanism behind most of the very high ratios you see quoted.
Average order value and margin. For ecommerce, bundling, subscription options and merchandising raise the gross profit a single customer produces per order. Margin work counts twice, because gross margin sits inside the lifetime value numerator and inside the payback calculation.
One warning about optimising the ratio directly. Both halves improve if you acquire fewer and better customers, and taken far enough that produces an excellent ratio attached to a shrinking business. The ratio is a constraint to satisfy rather than a number to maximise. Read it against growth, and treat a rising ratio in a flat account as a signal to spend more.
Find out what your ratio really is
Most accounts we look at are computing a ratio on a blended acquisition cost that includes organic customers, a lifetime value built on revenue rather than gross profit, or both. The corrected number is usually a long way from the reported one. A free ad audit will rebuild the acquisition cost half from your conversion setup, your new versus returning split and your close rate, then show which segments are actually carrying the blended figure. It takes a few days and there is nothing to sign.