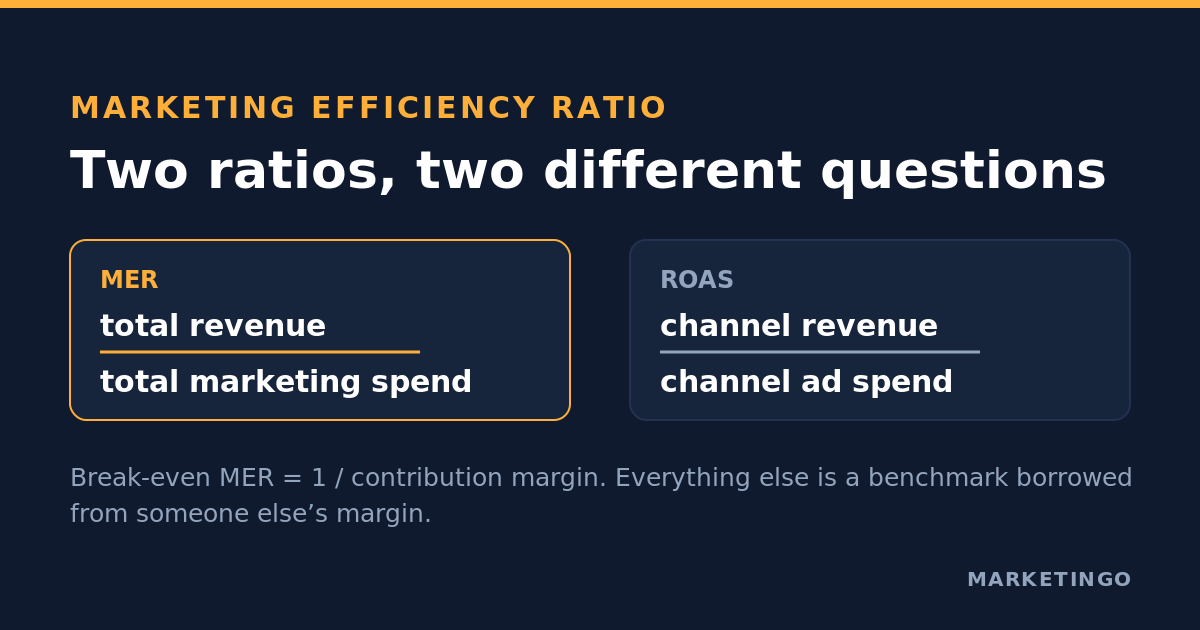
The marketing efficiency ratio is one division:
MER = total revenue / total marketing spend
Return on ad spend is a different division, taken at a narrower scope:
ROAS = revenue attributed to a channel / spend on that channel
A store that books $1,000,000 in the month and spends $250,000 across every paid and retention channel has a MER of 4.0. That is the whole calculation. MER is also called blended ROAS, and the two names describe the same arithmetic, which is the first place this topic starts to get confusing. The second place is that one of the most widely used analytics platforms in ecommerce publishes the ratio the other way up, so a MER of 4.0 and a MER of 0.25 can describe the same business.
This piece covers the formula, what a good MER is once you account for your own margin, the benchmarks by revenue stage, the decision rule for when to act on MER instead of ROAS, and what happens to the metric in B2B lead generation, where it quietly breaks.
The marketing efficiency ratio formula, stated plainly
Take every dollar of revenue the business recognised in a period. Take every dollar of marketing spend in that same period. Divide the first by the second.
A brand doing $400,000 in monthly store revenue against $100,000 in total marketing spend runs a MER of 4.0. Cut spend to $80,000 and hold revenue, and MER rises to 5.0. Hold spend and grow revenue to $500,000, and MER also rises to 5.0. Nothing else enters the calculation.
Two variants matter in practice. Blended MER is the number above: all revenue, all spend. New-customer MER, usually written nMER, is new-customer revenue divided by acquisition-only spend. The distinction is not academic. Blended MER includes repeat purchases, so a strong email and SMS programme can hold the blended number up while the acquisition engine underneath it is losing money on every new customer. Run blended MER as the business number and nMER as the acquisition diagnostic.
The appeal of MER is that both inputs are facts rather than estimates. Store revenue comes from the commerce platform, Shopify for most DTC brands. Spend comes from the billing side of each ad account. Neither number depends on a pixel firing, a cookie surviving, or a platform deciding it deserves credit for a conversion. That is also why a marketer can put MER in a board pack and defend it line by line, which is rarely true of a platform-reported figure.
MER and ROAS measure different things on purpose
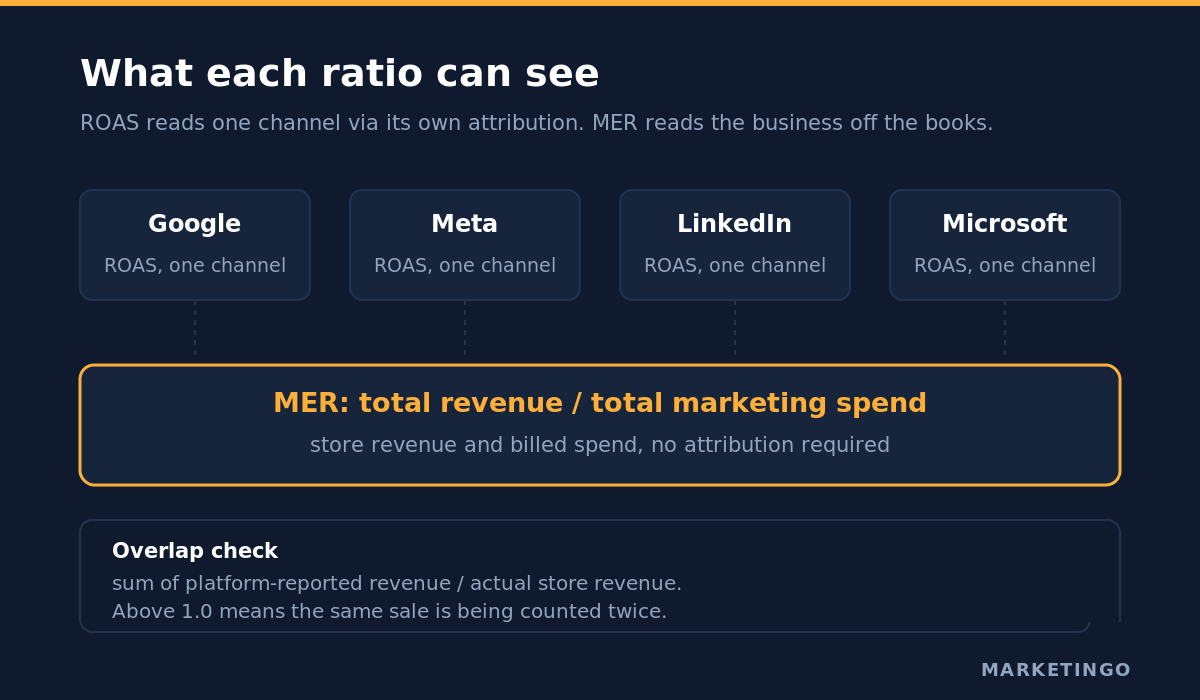
ROAS answers a channel question: for the money put into this campaign, how much revenue did the platform record against it? MER answers a business question: for every dollar spent on marketing, how much revenue did the company book?
The gap between those two questions became a practical problem after Apple's App Tracking Transparency prompt rolled out in 2021 and stripped platforms of deterministic conversion data. Modelled conversions filled the hole, and modelled conversions overlap. Meta and Google can both claim the same purchase, so channel-reported revenue across an account routinely adds up to more than the store actually sold.
That overlap is measurable, and it is worth measuring. Add up the revenue every platform reports for a month, then divide by the store's actual revenue for that month. A result of 1.0 means the platforms are collectively telling the truth. A result of 1.6 means 60% more revenue is being claimed than exists, and any budget decision made by comparing one platform's ROAS to another's is being made on inflated numbers that are inflated by different amounts. MER has no such problem because it never asks a platform to attribute anything.
The trade-off is that MER cannot tell you which campaign to turn off. It is a single number for the whole business, so it moves for reasons that have nothing to do with media: a price change, a promotion, a supply issue, or a good week of organic sales. A marketing strategy built on MER alone will be directionally right and operationally useless, because the metric describes the outcome of your marketing efforts without identifying which of them produced it.
The MER on your dashboard might be inverted
This is the detail that causes the most confusion, and it is checkable in the vendor's own documentation.
The canonical formula is revenue divided by spend, producing a multiple. Triple Whale's data dictionary defines the metric the other way: its MER documentation states plainly that MER = Blended Ad Spend / Order Revenue, and adds that for the inverse ratio, Order Revenue divided by Blended Ad Spend, you should use its Blended ROAS metric instead. The underlying SQL in that same document divides spend by order revenue.
So the on-screen number is a cost ratio, the share of revenue going to media, rather than a multiple. A business running a canonical 4.0x MER shows up as 0.25, or 25%, in that view. Both numbers are correct and both describe identical performance. Eightx, a fractional CFO firm working with DTC and CPG brands, makes the same observation and reports that Polar Analytics and Northbeam use the canonical revenue-over-spend form, which is why operators comparing a dashboard against a finance article so often think one of them is broken.
Before benchmarking your MER against anything, confirm which direction your tool reports it. If the number is below 1, or displayed as a percentage, you are looking at the cost ratio, and the multiple everyone quotes is 1 divided by it.
What counts as marketing spend
The denominator is where most self-reported MER figures quietly go wrong. Every marketing dollar in the period belongs in it: paid media across Google, Meta, LinkedIn, Microsoft and the marketplaces, retention tooling, affiliate and influencer payouts, agency fees, and creative production billed as a marketing expense.
Leaving out agency retainers and email platform costs is the common omission, and it flatters the ratio. A brand spending $100,000 on media plus $15,000 on fees and tooling against $400,000 revenue is running 3.5, not 4.0. That is a 12% overstatement, which is enough to move a business from below break-even to apparently above it. If you intend to compare against published benchmarks, include what those benchmarks include, and write down the definition somewhere so the number means the same thing in six months.
A healthy MER of 3x to 5x is a margin assumption in disguise
Almost every article on this topic reports a healthy MER of roughly 3.0 to 5.0 for ecommerce. The band is not wrong, but it is stated almost everywhere without the assumption that produces it, and that assumption is the only part of it that applies to your business.
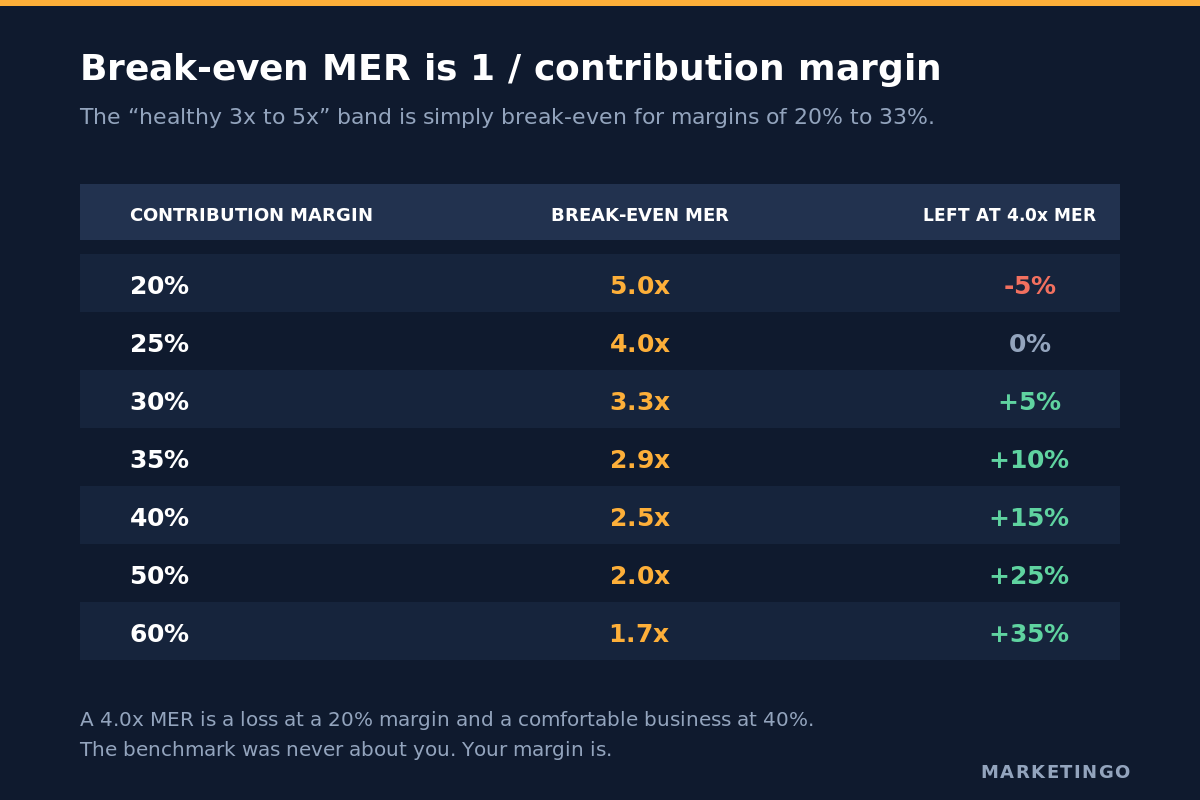
Break-even MER is 1 divided by your contribution margin. At a 25% contribution margin, break-even is 4.0. At 40%, it is 2.5. Below that line, every incremental dollar of marketing loses money on a first-order basis and the brand is buying customers on a lifetime-value bet, which may be a perfectly sound decision as long as it is a decision rather than an accident.
| Contribution margin | Break-even MER | Contribution left after marketing at a 4.0x MER |
|---|---|---|
| 20% | 5.0x | minus 5% of revenue |
| 25% | 4.0x | 0%, exactly break-even |
| 30% | 3.3x | 5% of revenue |
| 35% | 2.9x | 10% of revenue |
| 40% | 2.5x | 15% of revenue |
| 50% | 2.0x | 25% of revenue |
| 60% | 1.7x | 35% of revenue |
Read the middle column back and the famous benchmark decodes itself. A 3.0x to 5.0x band is exactly the break-even range for contribution margins between 20% and 33%. The industry rule of thumb is a restatement of an assumption that most DTC brands keep 20 to 33 cents of each revenue dollar after cost of goods, shipping, payment fees and returns. If your margin sits outside that range, the benchmark was never about you. A 60%-margin skincare brand hitting 3.0 is comfortably profitable. A 20%-margin electronics reseller hitting the same 3.0 is losing money on every order and reading an industry average as reassurance.
That is why the ratio should never be read on its own. It measures efficiency, not profitability, and the distance between the two is your margin. Put contribution margin next to MER permanently, so break-even stays visible on the same screen. You can size the arithmetic for your own catalogue with the ecommerce ROAS calculator, which works the same break-even logic at channel level.
MER benchmarks by revenue stage in 2026
Stage matters more than vertical, because the mix of new to repeat customers changes as a brand matures and repeat revenue arrives at almost no marginal media cost. Eightx's 2026 figures, published in June 2026 and drawn from its DTC ad-spend index, put the ranges here:
| Annual revenue | Typical blended MER |
|---|---|
| $1M to $5M | 1.5 to 2.5 |
| $5M to $10M | 2.5 to 3.5 |
| $10M to $25M | 3.0 to 4.5 |
| $25M to $100M | 3.5 to 6.0 or higher |
| Subscription and high-LTV brands | 1.5 to 2.5, defended on cohort LTV |
Two things follow. Smaller brands often run below first-order break-even and are right to, provided the repeat rate genuinely arrives. And subscription brands deliberately sit at the bottom of the table, which makes a subscription MER meaningless without the cohort data underneath it. For channel-level context alongside these figures, our guide to what counts as a good ROAS covers the platform medians by network.
Which number to act on, and what to do when they disagree
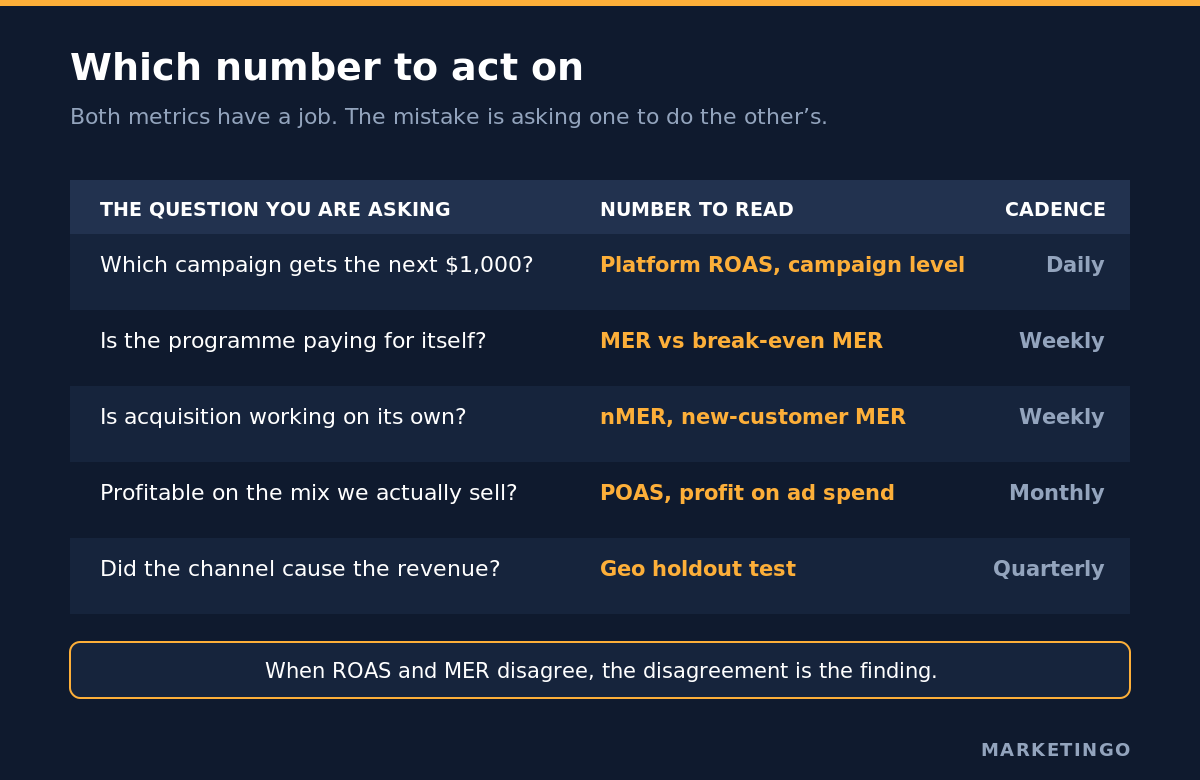
The practical answer is that both metrics have a job, and the mistake is asking one of them to do the other's.
| The question you are actually asking | Number to read | Cadence |
|---|---|---|
| Which campaign gets the next $1,000? | platform ROAS at campaign level | daily |
| Is the marketing programme paying for itself? | MER against your break-even MER | weekly |
| Is acquisition working, separate from retention? | nMER | weekly |
| Are we profitable on the mix we are actually selling? | POAS, profit on ad spend | monthly |
| Did the channel cause the revenue or just claim it? | geo holdout or incrementality test | quarterly |
Platform ROAS tells the media buyer which dial to turn. MER tells the business whether turning it helped. When the two disagree, the disagreement is information, and it usually falls into one of three patterns.
Channel ROAS holds steady while MER falls. Spend has grown into less incremental territory, most often retargeting and brand terms harvesting demand that would have converted anyway. The platform records the sale and reports a healthy return, but the business gained nothing. Test it with a holdout before cutting.
Channel ROAS falls while MER holds. Usually a sign that upper-funnel spend is working. The platform cannot see the delayed and cross-device conversions it caused, so the credit lands in direct and organic instead. Cutting the channel because its own dashboard looks weak is the classic error here.
Both fall together. This one is rarely a media problem. Check price, promotion depth, stock availability and site conversion rate before touching campaign budgets.
MER for B2B lead generation, and where the formula breaks
MER assumes revenue lands in the same period as the spend that produced it. In ecommerce that is broadly true. In B2B lead generation it is false, and the metric fails in a way that is easy to miss because it still returns a plausible-looking number.
Run a 90-day sales cycle and this month's MER divides this month's closed-won revenue by this month's media spend. Those two figures belong to different cohorts. The revenue came from leads generated a quarter ago at a spend level that may have been half or double today's. The ratio is arithmetically valid and analytically meaningless, and it will look best in the month after you cut budget, because spend falls immediately while revenue from the previous quarter's pipeline keeps arriving.
Three replacements do the job MER does for ecommerce:
- Blended CAC, total sales and marketing spend in a period divided by new customers won in that period. It carries the same lag problem, so read it on a trailing window offset by roughly one sales cycle rather than month to month.
- Cost per sales-qualified lead, which resolves in days rather than quarters and is the number a media buyer can actually act on weekly.
- Pipeline coverage, the value of pipeline created against the revenue target it has to produce. This is the closest B2B analogue to a blended efficiency read, because it looks forward rather than backward.
Cohort matching is the honest version of MER here. Tag leads by the month their spend was incurred, then measure closed-won revenue from that cohort when the cycle completes. It reports late by design, which is the point: the alternative reports on time and reports the wrong thing.
There is a legitimate exception. Self-serve and product-led B2B with a short cycle, where a signup converts to paid within days, behaves like ecommerce and can use MER directly. Hybrid motions can run MER on the self-serve revenue line and cohort-based CAC on the sales-assisted one. For everything with a real sales cycle, size the economics with the lead generation ROI calculator rather than forcing a blended ratio onto a funnel that does not fit it.
How to run MER inside a paid media account
Set the break-even number first. Calculate 1 divided by contribution margin, write it on the dashboard, and treat every MER reading as a distance from that line rather than as a score.
Then hold the reporting cadence steady. MER read daily is noise, because a single large order or a slow Tuesday moves it. Weekly is the shortest window that means anything for most brands, and monthly is better for anything with a long consideration cycle.
Change one thing at a time. Because MER aggregates everything, a week in which budgets moved on two channels, a promotion ran and a new creative launched produces a MER change nobody can attribute. Sequencing budget shifts is slower and it is the only way the number teaches you anything.
Keep nMER visible next to blended MER, since the two diverging is the earliest reliable signal that acquisition is deteriorating behind healthy-looking retention revenue. And when a channel's contribution is genuinely in doubt, resolve it with a geo holdout rather than an attribution argument. Incrementality testing is the only method that answers the causation question, and it is the natural companion to a blended metric: MER tells you efficiency changed, a holdout tells you which channel changed it.
Where MarketinGO fits
MarketinGO is a paid media agency for US and European clients, running Google, Meta, LinkedIn and Microsoft Ads for DTC ecommerce brands and high-ticket B2B lead generation. Reporting on every account is built around break-even and blended efficiency rather than the platform multiple, for the reason this article makes: the dashboard number and the P&L number answer different questions, and only one of them pays salaries.
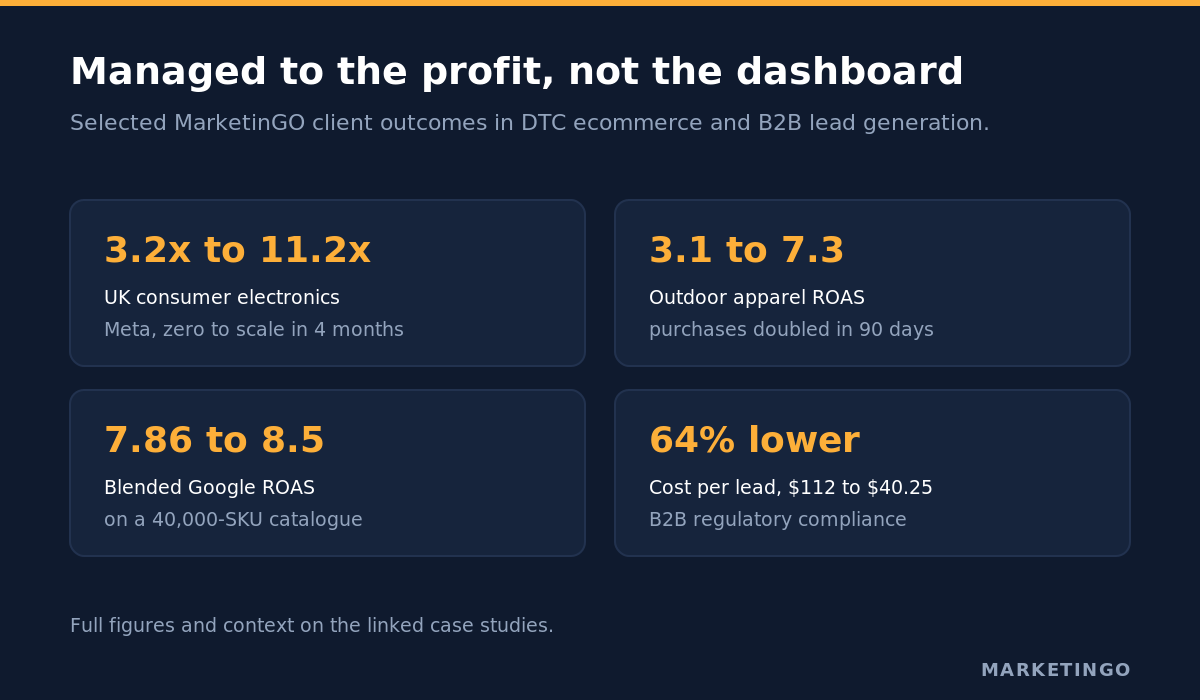
On the ecommerce side, a UK consumer electronics brand went from a 3.2x to an 11.2x ROAS and from zero to profitable scale in four months on Meta, and an outdoor apparel brand lifted ROAS from 3.1 to 7.3 while doubling purchases in 90 days during its off-season. On a roughly 40,000-SKU catalogue, cutting the 37% of budget going to zero-revenue products lifted blended Google ROAS from 7.86 to about 8.5 while spend grew. On the lead generation side, a regulatory-compliance company saw cost per lead fall 64%, from $112 to $40.25, over six months.
If your blended number and your platform numbers are telling different stories and you are not sure which to believe, a free ad audit reconciles them against actual store or CRM revenue. Our Google Ads management and Meta advertising pages cover how the channels are run day to day, and the ROAS formula guide sets out the channel-level calculation that sits underneath the blended one.