Average order value, usually shortened to AOV, is the average revenue an order brings in. You calculate it by dividing total revenue by the number of orders over the same period.
AOV = total revenue ÷ total number of orders
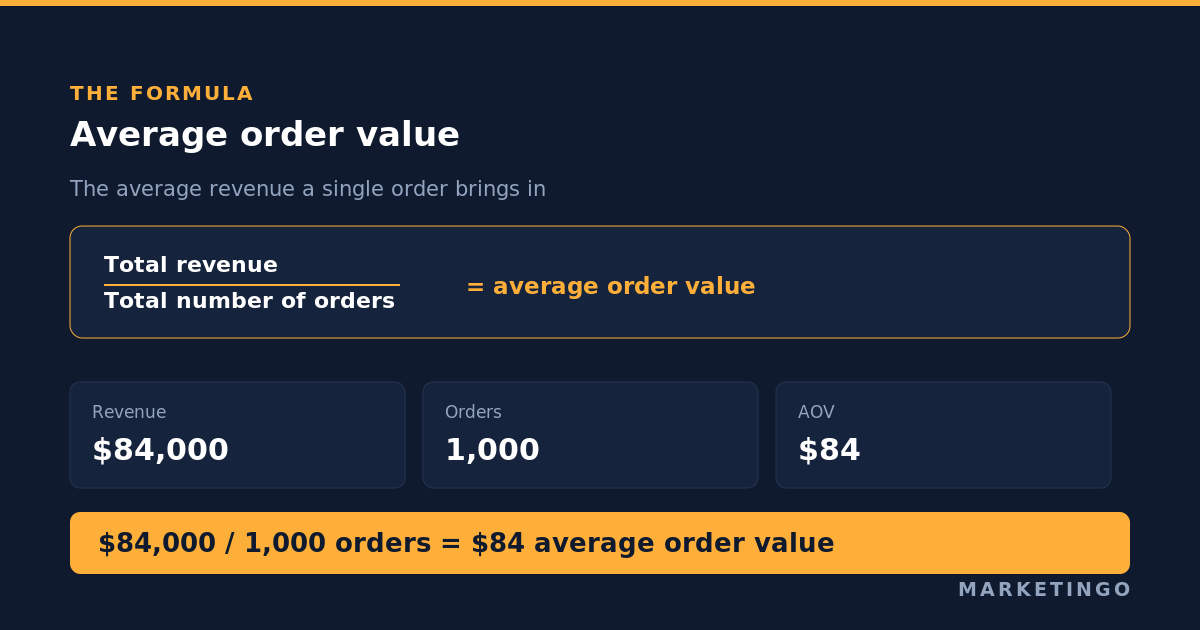
An online store that books $84,000 across 1,000 orders in a month has an AOV of $84. That is the whole calculation, and it is the only part of this metric nobody argues about.
Everything that matters sits in the words "total revenue". Revenue before or after discounts. Before or after returns. With shipping and sales tax, or without. Each choice moves the number, and two of the tools in your own reporting stack resolve them differently, so a single ecommerce business can honestly report two different AOVs on the same month.
That ambiguity is not an accounting footnote. AOV is the revenue input to break-even return on ad spend, so whichever version you feed it decides the cost per click you are willing to pay. Get it wrong in the optimistic direction and you will bid against revenue that never reaches your bank account.
This article covers the formula and the two definitions your platforms use, what measured benchmarks look like in 2026, the four mechanisms that raise AOV without raising profit per order, how to calculate contribution margin per order instead, and the levers worth pulling once you can tell the difference.
Why AOV is an important ecommerce metric
AOV earns its place on the dashboard for one structural reason: it is the only lever in the acquisition equation that does not require winning another customer.
An ecommerce store has three ways to grow revenue. Bring in more traffic, convert more of it, or get more revenue per order. The first two cost money and get harder as you scale, because each additional visitor is drawn from a less interested pool and each conversion rate gain is fought for against a shrinking ceiling. Revenue per order is different. The customer is already there, already buying, and already past the hard part.
That logic is why every upselling tool, bundle app and loyalty program vendor has published a guide to increasing AOV. It is also where those guides stop, because the logic holds for revenue and not necessarily for profit.
The second reason is arithmetic. AOV sets what you can afford to pay for a customer. Your break-even return on ad spend is 1 divided by your contribution margin, and your maximum cost per acquisition is the margin a single order leaves behind. A store with an $84 AOV and a 40% contribution margin can spend up to $33.60 to win an order. Lift AOV to $110 at the same margin and the ceiling moves to $44. That extra $10.40 of headroom per order is what lets you outbid a competitor on the same keyword, which is why AOV work and paid media work belong in the same conversation rather than in different quarters.
How to calculate and track average order value
The formula is simple enough that the work is all in the inputs. To calculate average order value for any period, take the revenue booked in that period and divide it by the number of orders in the same period. Use orders, not customers and not sessions: a customer who buys three times in a month counts as three orders, and that is correct, because AOV measures the transaction rather than the relationship.
Where to find it. Shopify reports it in the sales overview and in the sales reports, so most merchants read their store's average order value there. In Google Analytics 4 there is no metric called AOV; you build it by dividing purchase revenue by the ecommerce purchases count, or you read average purchase revenue, which is the closest equivalent. Both are a few clicks away, which is why so few teams go the extra step of reconciling them against finance.
Three habits separate teams who track average order value usefully from teams who merely display it.
Pick a window long enough to be stable. AOV is an average over a small denominator in most stores, so read it monthly, or weekly only if you take several hundred orders a week. Watching a daily figure tells you about yesterday's order mix and nothing about customer behavior.
Always show it next to order count. The average amount of money customers spend per order and the number of orders move independently, and the interesting cases are when they move in opposite directions. Revenue flat with a higher AOV and fewer orders is a different business problem from revenue flat with a lower AOV and more orders, and the AOV number alone cannot tell you which you have.
Segment it before you act on it. A blended figure across new and returning customers, across devices, and across acquisition channels hides more than it shows. New customers typically spend less per transaction than your existing customer base, so a month of successful prospecting lowers your current AOV while growing the business. Segmenting by channel also tells you something your bidding can use directly: if paid social brings a $55 average order and paid search brings $95, those two channels deserve different cost per acquisition targets rather than one blended goal.
Shopify and Google Analytics do not calculate AOV the same way
Before benchmarking anything, find out what your own reporting counts. The two systems most ecommerce brands read every day resolve "total revenue" differently, and neither of them subtracts returns.
Shopify. On 9 January 2023 Shopify changed the definition it uses in admin reporting. AOV had been based on the total sales value of an order. It is now based on "gross sales minus discounts", and it explicitly excludes "any adjustments made to the order after it was created". Two consequences follow. Discounts are deducted, which is the sensible choice. Anything that happens to the order afterwards, including a refund, is not, so a fully refunded order still counts toward your Shopify AOV at its full discounted value. Shopify applied the change retroactively to historical data, so a year-over-year comparison that straddles early 2023 is comparing two definitions.
Google Analytics 4. Google's ecommerce measurement guidance defines the value parameter on a purchase event as the sum of price multiplied by quantity across all items, and passes tax and shipping as separate parameters alongside it. Follow that specification and your Google Analytics revenue is a merchandise subtotal, with shipping and sales tax sitting outside it. Many implementations do not follow it and pass an order grand total into value instead, which inflates revenue by whatever shipping and tax the customer paid.
So the same month can produce three defensible figures: a Shopify number net of discounts but gross of refunds, a Google Analytics number that may or may not include shipping depending on how the tag was built, and a finance number net of everything. None is wrong. They answer different questions.
The practical rule: pick the definition closest to the money you keep, write it down, and use that one everywhere. When you compare your AOV against any published benchmark, assume the benchmark used gross revenue unless it says otherwise, because most do.
Average order value versus the metrics it gets confused with
Four metrics in this family sound alike and answer different questions, and the confusion is common enough to be worth settling.
Average order value is revenue divided by orders. It describes one transaction.
Average transaction value, sometimes abbreviated to ATV, is the same calculation under a different name, more common in retail and point of sale reporting than in ecommerce. If a report uses it, read it as AOV.
Average cart value is not the same thing, although the terms get swapped freely. A cart becomes an order only when it is paid for, so average cart value includes abandoned carts and is therefore usually lower. If a tool reports both, check which one you are looking at before comparing either against a benchmark.
Revenue per visitor is revenue divided by sessions, which folds conversion rate and AOV into a single figure. It is the better metric for judging a change that affects both at once, which is most of the interesting ones. A free shipping threshold that raises AOV and lowers conversion rate shows up as a wash in revenue per visitor and as a clear win in AOV, and revenue per visitor is telling you the truth.
AOV also gets set against customer lifetime value, but these are not alternatives. One measures an order and the other measures a customer across every order they place. Among the important ecommerce metrics they sit at different time horizons, and a business with strong repeat purchase rates should rely on lifetime value for budget decisions and use AOV to understand the unit economics underneath each order.
AOV benchmarks in 2026, and why most of the tables you will find are recycled
Honest benchmarking for this metric is harder than it looks. Search for average order value by industry and you will find dozens of tables of tidy figures, almost none of which name a measured source or the period the data covers. Tracing them tends to end at another article citing a third.
One source does publish its own measured data on a monthly cycle with the period stated. IRP Commerce reports ecommerce market data from the stores on its platform, broken out by sector. For August 2026 it reported an all-markets AOV of £129.23, up 6.28% year over year, against an all-markets conversion rate of 2.23%.
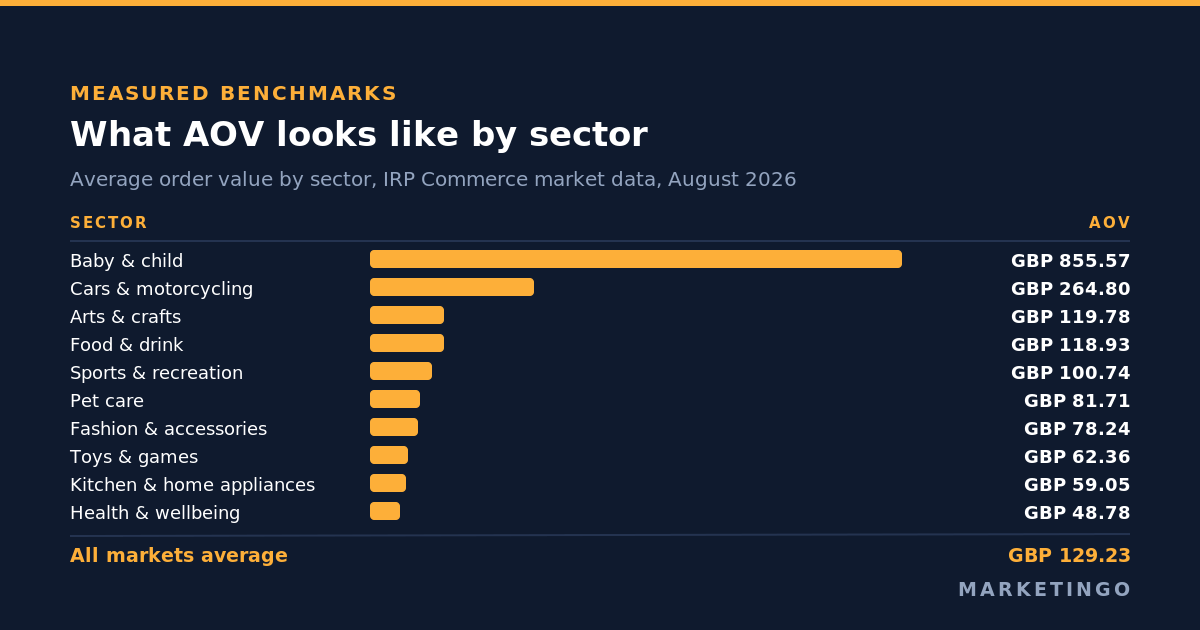
The sector spread in that data is the useful part, and it is very wide. Baby and child ran £855.57 and health and wellbeing ran £48.78 in the same month, a spread of roughly 17 times. Fashion clothing and accessories sat at £78.24, food and drink at £118.93, cars and motorcycling at £264.80, pet care at £81.71, sports and recreation at £100.74, arts and crafts at £119.78, toys and games at £62.36, and kitchen and home appliances at £59.05.
Two caveats that matter more than the figures. This is a United Kingdom dataset reported in pounds, drawn from one platform's merchant base, so treat it as a shape rather than as a target. And a single month in a category with few high-value orders moves a long way on a small number of transactions, which is the most likely explanation for a baby and child figure ten times the fashion one.
What to do with any benchmark table, including that one: use it to check whether your AOV is plausible for what you sell, then stop. The number worth managing against is your own trend and your own margin, because a good AOV is defined by your cost structure and nothing else. A store selling £40 consumables at a 70% margin is healthier than one selling £400 furniture at 8%.
The claim worth interrogating: a higher AOV does not always raise your bid ceiling
Here is the assumption running underneath almost every guide in this category. Raise AOV, raise the revenue per order, and therefore raise what you can afford to bid. The first two steps are true. The third fails often enough that it deserves to be the thing you check first, because four common mechanisms raise reported AOV while leaving profit per order flat or lower.
Discount-funded bundles. A bundle that moves two $40 products at $70 raises AOV from $40 to $70 and cuts $10 of margin off the pair. Whether the bid ceiling moves depends entirely on whether the second unit was going to sell anyway. If it was an incremental purchase, you have gained. If the customer would have bought both separately, you have paid $10 for a bigger number on a dashboard. Since Shopify deducts discounts from AOV but no report tells you what would have happened otherwise, this is the mechanism that most often flatters a bundling program.
Free shipping thresholds. A free shipping threshold set just above your AOV is the standard advice, and it works: carts do rise toward the line. It also hands the shipping cost to you on every order that crosses it, and it suppresses conversion rate among customers who will not reach the threshold at all. A threshold that lifts AOV 15% while reducing orders 8% and adding $6 of carriage to the ones that convert can easily be margin-negative. The test is contribution per visitor, not AOV.
Returns. Neither Shopify's AOV nor a standard Google Analytics purchase number is net of refunds, and the gap is not small. The National Retail Federation, with Happy Returns, put total United States retail returns at $849.9 billion in 2025, 15.8% of annual sales, and the online return rate specifically at 19.3%. An AOV of $84 on an ecommerce store returning at the online average represents roughly $68 of revenue retained. Any bid ceiling built on the $84 is about 23% too generous, and in apparel, where return rates run well above the average, the error is larger.
Product mix. This one is the most overlooked, because it needs no customer to change their behaviour at all. AOV is an average across whichever orders you happened to receive, so anything that changes the composition of those orders changes AOV. Stop advertising your cheap entry products and AOV rises. Launch a successful campaign on them and AOV falls, while total profit grows. In one large-catalogue account we manage, a restructure found that 37% of ad spend was going to products generating no revenue across a catalogue of roughly 40,000 products; excluding them lifted return on ad spend from 7.86 to 8.48 and more than doubled purchases. A spend reallocation of that size moves AOV as a side effect, in whichever direction the surviving mix points. Reading that movement as a behavioural win, or a behavioural loss, would be a mistake in both directions.
The common thread: AOV is a revenue average, and every one of these four mechanisms changes revenue and cost by different amounts. The metric cannot see the difference. You have to.
Contribution margin per order, the version your bids can use
The fix is not to abandon AOV. It is to carry it one step further, to the number that survives contact with your profit and loss statement.
Contribution margin per order = AOV × (1 − return rate) − cost of goods per order − fulfilment and shipping cost per order − payment processing fees
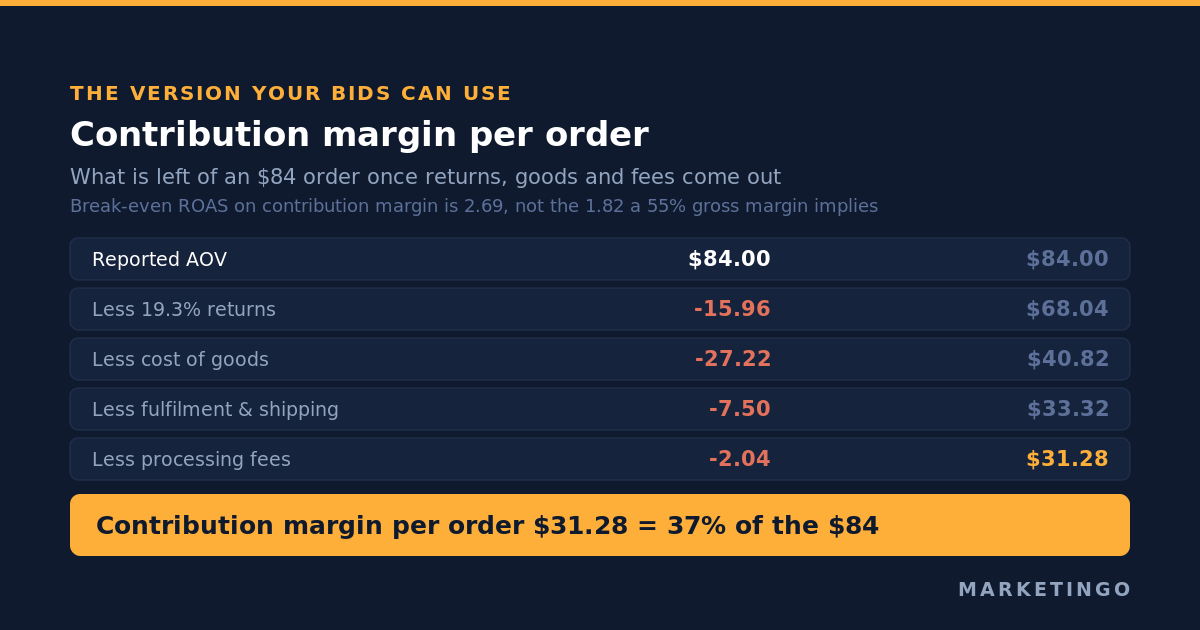
Work the $84 example through it. Returns at the 19.3% online rate leave $68.04 of retained revenue. Cost of goods at 40% of that is $27.22. Fulfilment and shipping run $7.50 and payment processing takes 3%, or $2.04. What is left is $31.28, a contribution margin of 37% on the original $84.
That $31.28 is your maximum cost per acquisition. It makes your break-even return on ad spend 84 divided by 31.28, or 2.69, against the 1.82 you would have calculated from a 55% gross margin read straight off the dashboard. The difference between those two numbers is the difference between a profitable account and one that looks fine in platform reporting while losing money per order. Our break-even ROAS guide works through that calculation in full, and the ecommerce ROAS calculator will do the arithmetic on your own figures.
Run the same calculation before and after any change meant to raise AOV. A bundle, threshold or upsell that raises contribution margin per order is a win. One that raises AOV while contribution margin per order holds still has cost you something to produce a flattering chart.
For lead generation businesses the equivalent question is what a closed deal leaves behind rather than what an order does, which runs through cost per lead and close rate instead; the lead generation ROI calculator covers that side.
Ways to improve AOV that survive the margin test
With that test in hand, the standard list of strategies to increase AOV sorts itself into the ones that reliably hold margin and the ones that need watching. Each of these AOV strategies works by getting a customer to buy either more units or a higher value version of what they already chose, and the margin question is always whether the extra revenue arrived with its margin attached.
Upselling to a better version. Offering a larger size, longer subscription or higher specification usually carries the same or better percentage margin, because you are selling more of what you already make. This is the most reliable way to increase average order value and the first place to look, because the customer has already decided to buy and you are only helping improve what they buy.
Cross-sell and order bumps at the right moment. A relevant accessory offered after the purchase decision adds revenue at full margin and does not compete with the main product for attention. Post-purchase offers are structurally safer than anything inserted before the customer has committed, because they cannot depress conversion rate.
Bundles priced on margin, not on a round discount. Bundling is sound when the bundle discount is smaller than the margin on the incremental unit, and when the bundle sells to customers who were buying one item. Price bundled products by working out the margin you keep on the pair, not by applying a standard 10% off.
Volume and tiered incentives. Buy-two-get-one and quantity breaks work in categories where consumption is elastic, because the customer genuinely uses more. In categories where it is not, you are pulling forward a purchase they would have made next month, which raises this month's AOV and flattens the next.
Free shipping thresholds, measured properly. Keep them, set the threshold 20% to 30% above your current AOV, and judge the result on contribution per visitor over a full purchase cycle rather than on AOV alone.
A loyalty program. A loyalty program raises order frequency more reliably than it raises order size, which makes it mainly a customer retention lever that happens to touch AOV. Judge it on repeat rate.
Catalogue and campaign structure. The paid media side of this is usually the fastest available gain, and the least discussed. Which products you advertise, and at what budget, determines the mix of orders you receive. Segmenting a catalogue so that budget follows products with real margin, rather than whatever the algorithm found cheapest, changes both AOV and profit in the same direction. That work sits in Google Ads campaign structure and in the Meta Ads catalogue setup, and for most ecommerce and direct-to-consumer brands it is where the first real margin gain is found.
When AOV is the wrong metric to steer on
Three situations where optimizing AOV actively hurts.
When you are acquiring customers for the second purchase. A deliberate low-price entry product exists to recruit, so measuring it on AOV condemns the strategy before the repeat revenue arrives. Judge it on customer lifetime value and payback instead. Our guides to customer acquisition cost and the LTV to CAC ratio cover that framing.
When the product range is genuinely bimodal. A store selling both £15 accessories and £900 machines has a meaningless blended AOV, because no order resembles the average. Segment it by product line or customer type and manage each separately.
When you are reading it over too short a window. AOV is an average over a small denominator in most accounts, so a handful of large orders moves a weekly figure substantially. Read it monthly at minimum, and alongside order count, so you can see whether a rise came from behaviour or from a change in the mix.
The broader point is the one that runs through every metric on this site: a single ratio describes one slice of the business, and steering hard on any of them in isolation produces the result the ratio measures rather than the result you wanted. Marketing efficiency ratio and ROAS is the same argument applied one level up, and the ROAS formula explains why the revenue figure in the numerator needs the same scrutiny as the one in AOV. The full set sits in our resources.
Getting the number right in your own account
The sequence that works, in order.
- Write down which revenue definition you are using, and check what your Shopify reporting and your Google Analytics 4 tag each actually count. If they disagree, find out why before trusting either.
- Pull your return rate from finance rather than from an ecommerce platform, because the platform does not deduct it.
- Calculate contribution margin per order using the formula above, and keep it next to AOV on the same dashboard.
- Convert it into a break-even return on ad spend and a maximum cost per acquisition, then check those against what your campaigns are actually paying.
- Run every AOV initiative as a test measured on contribution per visitor, not on AOV.
Most accounts we audit are bidding against a revenue figure that has not been reduced by returns, cost of goods or shipping, which makes a profitable-looking account unprofitable at the order level. It is a reporting problem rather than a campaign problem, and it is usually visible within an hour of looking at the right two numbers side by side.
If you want a second pair of eyes on which number your campaigns are currently bidding against, our free ad audit covers exactly this: what your platforms are counting as revenue, what your true contribution margin per order is, and where budget is going to products that cannot carry it.