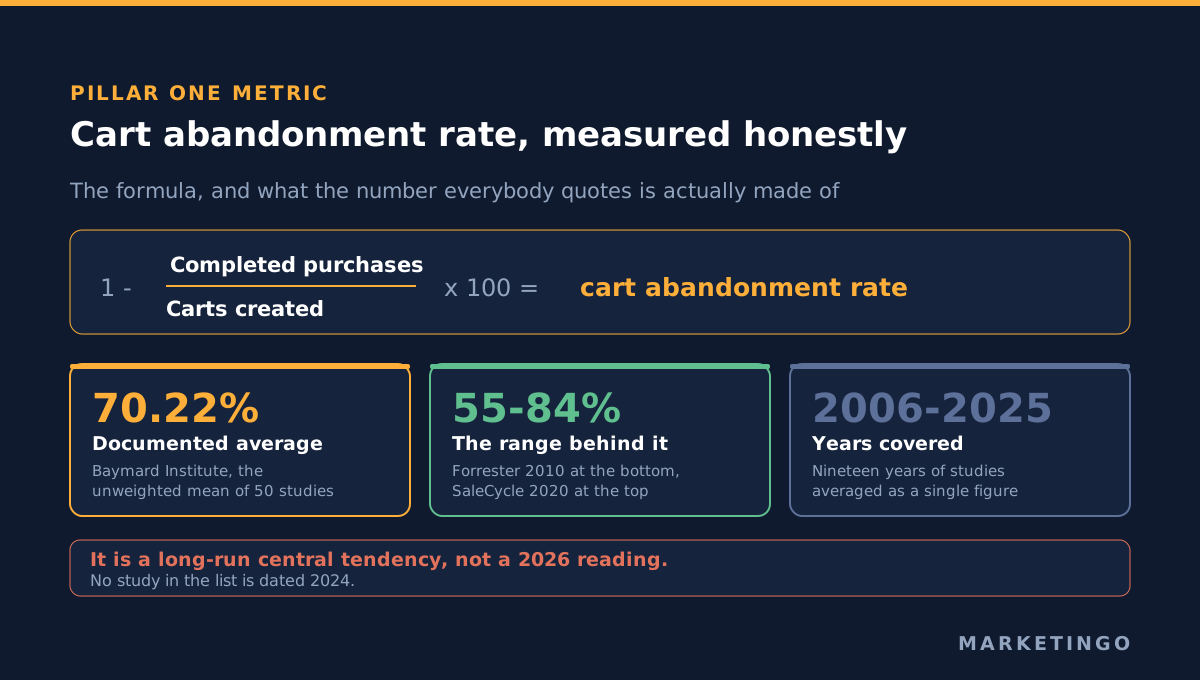
Cart abandonment rate, also written as shopping cart abandonment rate, is the share of shopping carts created that never become orders. Baymard Institute puts the documented average at 70.22%, and gives the formula as one minus completed purchases divided by carts created, times 100. That average is an unweighted mean of 50 studies published between 2006 and 2025, so it is a long-run figure rather than a reading of 2026.
Two things make this metric harder to use than it looks. The benchmark is older and wider than the single number suggests, and the denominator in the formula is one that most store analytics never counts. Both are fixable once you know they are there, and both explain why two stores quoting their abandonment rates are often not describing the same measurement.
The cart abandonment rate formula, and the denominator your analytics does not produce
The arithmetic is simple. Baymard Institute states it as:
Cart abandonment rate = (1 - completed purchases / carts created) x 100
The denominator is carts created. That is the problem, because a cart is not a thing either major analytics platform counts.
Shopify's behaviour reports count sessions. Its conversion funnel columns are "Sessions with cart additions", defined as the total number of sessions where a customer added a product to a cart, then "Sessions that reached checkout", defined as sessions where there was user input during checkout, then "Sessions that completed checkout" (Shopify Help Center). Shopify also notes that each step's rate is calculated against total sessions rather than against the step above it, and that a single session can contain more than one purchase.
Google Analytics 4 counts events. Its measurement reference lists add_to_cart, sent when an item is added to a cart, then begin_checkout, add_shipping_info, add_payment_info and purchase (Google Analytics developer documentation). None of those events carries a cart identifier. The only identifier in the purchase example is transaction_id. There is no cart object to count.
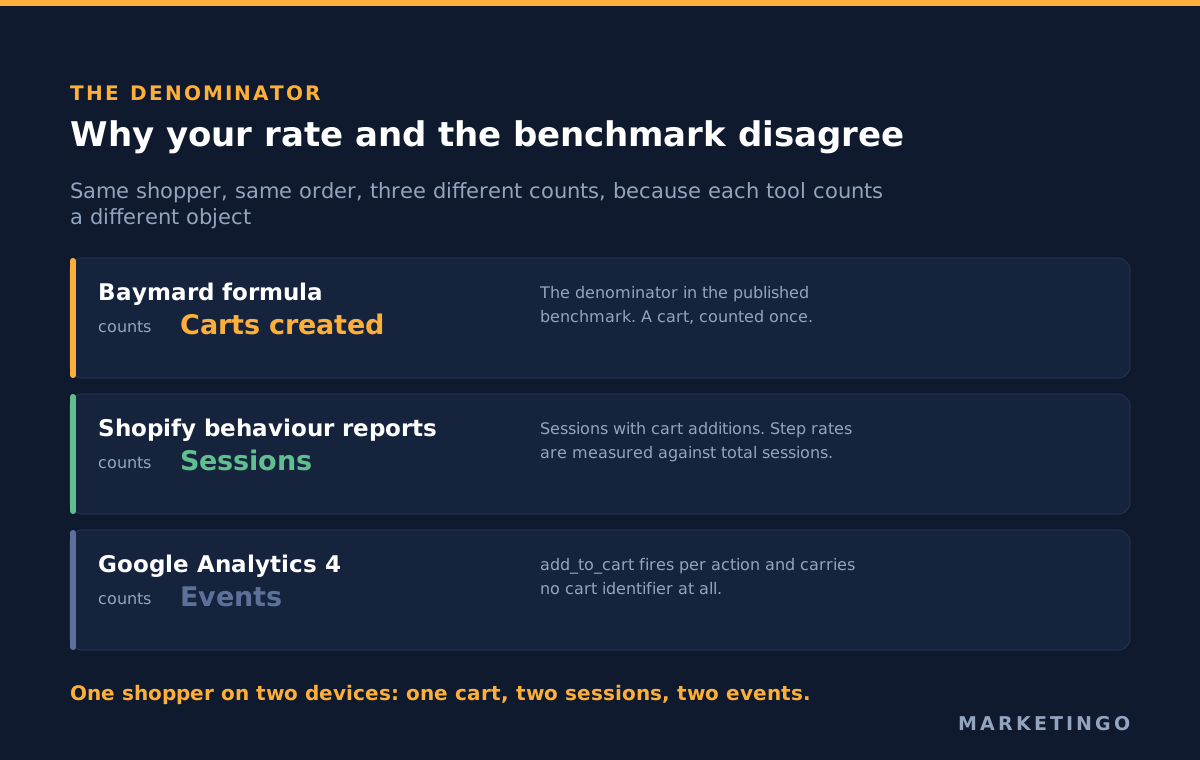
So the published benchmark is built on carts, your store reports sessions, and your analytics reports events. One shopper who adds to a cart on a phone at lunchtime and again on a laptop that evening is one cart in the Baymard sense, two sessions in Shopify and two add_to_cart events in Analytics. The three abandonment rates diverge without anything being broken, which is the same denominator problem that makes published ecommerce conversion rate benchmarks incompatible with each other.
The practical rule: pick one definition, write it down, and never compare your figure to a published average computed a different way. Compare it to your own figure from last month.
The average cart abandonment rate is a mean of 50 studies reaching back to 2006
The 70.22% number is one of the most cited statistics in ecommerce, and almost nobody reports what it is made of. Baymard is unusually clear about this on its own page, describing the figure as the plain, unweighted mean of every study listed, drawn from 50 studies published between 2006 and 2025.
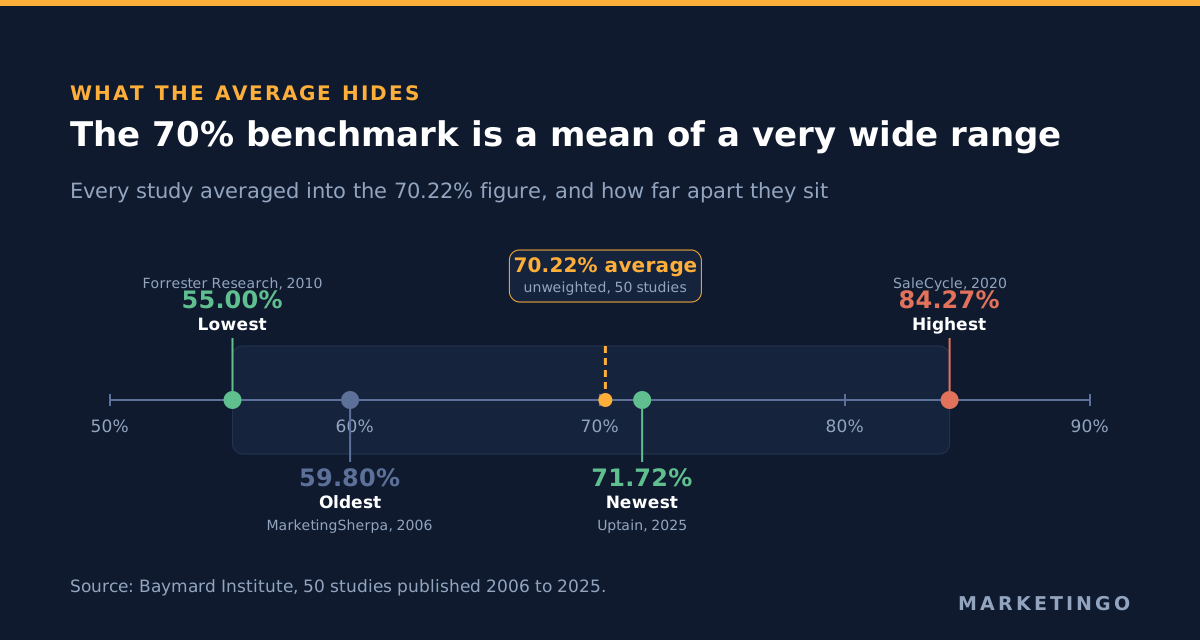
The abandonment rates behind that mean are what matter, and they spread wide:
| Study | Year | Rate | |
|---|---|---|---|
| Lowest | Forrester Research | 2010 | 55.00% |
| Highest | SaleCycle | 2020 | 84.27% |
| Oldest | MarketingSherpa | 2006 | 59.80% |
| Newest | Uptain | 2025 | 71.72% |
| Average of all 50 | 2006-2025 | 70.22% |
Four things follow from that table. The abandonment rates across studies run from 55% to 84%, a range wide enough that almost any store's number falls inside it. The oldest entry was published in 2006, the year before the first iPhone shipped, so part of the average predates mobile commerce entirely. No study in the list is dated 2024. And because the mean is unweighted, a small vendor sample from 2012 carries the same weight as a large one from 2025.
None of that makes the figure wrong. It makes it a long-run central tendency rather than a 2026 target, and it explains why published abandonment rates differ so much from one article to the next. If you want a benchmark you can act on, use the 55% to 84% range as the sanity check and your own trend as the measurement.
Baymard also separates what is recoverable from what is not. It reports that 42% of US online shoppers have abandoned a cart because they were just browsing and not ready to buy, and describes that portion as a natural consequence of how people shop online. On the other side of the ledger, it estimates a 35.26% conversion rate increase available to the average large ecommerce site from fixing documented checkout usability problems, which it translates into about $260 billion of recoverable orders against combined US and European ecommerce sales of $738 billion.
Reasons for cart abandonment, and which ones an ad account owns
Set the browsers aside and Baymard's survey of reasons for abandonment looks like this:
| Reason given | Share |
|---|---|
| Extra costs too high (shipping, tax, fees) | 40% |
| Delivery was too slow | 20% |
| Did not trust the site with card information | 19% |
| Site wanted the shopper to create an account | 18% |
| Checkout too long or complicated | 17% |
| Website had errors or crashed | 17% |
| Returns policy was not satisfactory | 13% |
| Could not see total order cost up front | 12% |
| Card was declined | 10% |
| Not enough payment methods | 9% |
Read that list as an ownership map. Nine of the ten reasons sit in the checkout process, the shipping policy or the payment setup, which means a paid media agency does not own them and should not pretend to. Honest scoping here is worth more than a sales pitch: if 40% of your abandoners are balking at shipping costs revealed at step three, no bid adjustment fixes that.
What an ad account does own is the composition of the traffic arriving at the cart. That is not a small thing, because it moves the rate in both directions and is the most common reason a cart abandonment rate changes with no site change behind it.
Split it into three: cart, checkout and payment abandonment rates
A single cart abandonment number tells you that people left. It does not tell you where. Break it into the three step abandonment rates your tracking already fires:
- Add to cart, then start checkout.
add_to_carttobegin_checkoutin Analytics,AddToCarttoInitiateCheckouton the Meta pixel. Loss here is usually price shock at the cart page: shipping, tax or a total that was not visible on the product page. - Start checkout, then add payment.
begin_checkouttoadd_payment_info. Loss here is friction inside the checkout process itself: a long form, forced account creation, or a missing payment option. - Add payment, then purchase.
add_payment_infotopurchase. Loss here is narrow and expensive: declines, errors, a final total that moved.
Meta's own definitions are useful boundaries for step two, since InitiateCheckout is specified as firing when a person enters the checkout flow prior to completing it, and AddPaymentInfo when payment information is added. Shopify's "reached checkout" step is stricter still, counting only sessions with actual user input during checkout rather than a checkout page view.
Most retailers find that one of these three step abandonment rates carries nearly all the loss. The work then has an address, and the headline figure goes back to being a monitoring number rather than a diagnosis.
How to reduce cart abandonment, reason by reason
The reasons table doubles as a fix list, ordered by how many shoppers each item costs. None of it needs new research. It needs someone to own it.
- Extra costs, 40%. Put shipping, tax and fees in front of the shopper before the cart page, or build them into the price. High shipping costs revealed at step three are the single largest documented cause of abandoned shopping carts, and a threshold for free delivery is cheaper than the orders it saves.
- Slow delivery, 20%. Show a delivery date rather than a shipping speed, and show it on the product page.
- Card details and trust, 19%. Visible payment logos, a familiar checkout layout and a security statement beside the card fields address this directly. A checkout that looks improvised loses orders on appearance alone.
- Forced account creation, 18%. Offer guest checkout, and offer account creation after the order is placed rather than before.
- A long checkout process, 17%. Cut fields to the ones you will actually use. Address autocomplete and wallet buttons remove most of the typing.
- Errors and crashes, 17%. Test the checkout process on real devices and real networks, not only on a developer machine. This is the cheapest item on the list and the most often skipped.
- Return policies, 13%. Link the policy from the cart. Shoppers who cannot find it assume the worst.
- No visible order total, 12%. Keep a running total with tax and delivery on screen throughout.
- Declines, 10%, and limited payment options, 9%. Add wallets, local methods and buy now pay later (BNPL) where your customers expect them, and check your gateway's decline reasons before assuming the issue is demand.
Almost all of that is conversion rate optimization work inside the store rather than paid media work, which is why Baymard attributes its estimated 35.26% conversion uplift to checkout usability rather than to traffic. It is worth saying plainly: if you want to reduce cart abandonment, this list is where the money is, and an ad account can only help you measure the result.
What paid media can and cannot do about abandoned shopping carts
Start with the uncomfortable half. Traffic quality moves this metric more than almost anything a store does to its checkout. Broaden targeting or chase a cheaper cost per click, and the share of carts built by people with no intention of buying goes up. Abandonment rates rise and nothing is actually broken. The reverse is also true, and it is the trap: a campaign optimized toward add-to-cart events will cheerfully buy you more carts than orders, which worsens the rate while the dashboard reports success. Optimize toward purchases and their value, not toward the cart.
The half an ad account genuinely owns is recovery, and the mechanics are specific.
On Google, the add_to_cart event is one of the recommended events for dynamic remarketing, and Google states that the event name is what assigns users to automatically generated lists. For retail the event must carry an id matching an id, item_group_id or display_ads_id in your Merchant Center product feed, plus google_business_vertical set to retail (Google Ads Help). Get the feed identifier wrong and the audience builds while the ads show the wrong products.
Two limits are worth knowing before you plan a recovery campaign. A data segment needs a minimum of 100 active visitors or users within the last 30 days to serve on Display, Search or YouTube, and membership duration defaults to 30 days with a maximum of 540 (Google Ads Help). A smaller store will not fill a cart abandoner audience fast enough to run it as a standalone campaign, which is an argument for folding abandoners into a broader remarketing pool rather than slicing the list thinner.
On Meta, the pixel reference lists contents on AddToCart as required for Advantage+ catalog ads. That property is what lets the ad show the item that was left behind rather than a generic brand message.
This is ordinary work rather than a trick, and it compounds with feed hygiene. On a roughly 40,000-product dental supplies catalogue we found 37% of spend going to products that had produced no revenue, lifted blended Google return on ad spend from 7.86 to about 8.5 while increasing spend, then expanded into Meta with catalog and remarketing campaigns. The remarketing only paid because the feed underneath it was correct first.
Cart recovery arithmetic, in money
Retargeting is not the only recovery channel, and for most stores it is not the cheapest. Owned messaging usually is, which matters when you are deciding how much paid budget to point at abandoners.
Klaviyo's 2026 benchmark report, drawn from an analysis of more than 110,000 of its customers, gives abandoned cart flows an average revenue per recipient of $6.77 for email and $4.48 for text message, with the top 10% of brands at $13.70 and $8.69. Average email click rate on the flow is 6%, and 11.3% for the top decile. By industry, Klaviyo reports home and garden and hardware and home improvement averaging around $15 per email recipient, with the top 10% in hardware and home improvement at $35.24.
Put that next to a retargeting cost per click and the budget question answers itself. If an abandoned cart email is worth $6.77 per recipient at the average, the paid media job is to make sure abandoners who are not reachable by email see the item again at a cost per click well under that, and that the campaign is measured on incremental orders rather than on the orders the email would have produced anyway. Run the two together, attribute them honestly, and the cart abandonment rate stops being a vanity statistic and starts setting a budget.
The same arithmetic feeds your efficiency targets. A cart that converts later still counts toward the order volume behind your break-even return on ad spend, and recovered orders usually carry a different average order value than first-session purchases, so keep them separable in reporting.
Why abandonment rates differ between tools, and how to measure yours
Five rules, in order of how much trouble they save:
- Fix the denominator and record it. Sessions with cart additions, unique carts, or users who added to cart. Any of them works. Changing it mid-year does not.
- Segment by device before you draw a conclusion. Mobile and desktop abandonment rates differ, so a figure that moved because mobile traffic share grew is not a checkout problem.
- Segment by source. Paid social, paid search and direct carry different abandonment rates, and blending them hides the one that changed.
- Watch the step abandonment rates, not the headline. The aggregate moves for a dozen reasons; each step moves for one.
- Check your tooling's definitions before trusting a trend. Shopify, for example, notes a session measurement rollout between 21 and 23 September 2026 that can shift session-based metrics, and keeps historical session data only back to 1 October 2022.
None of this requires new software. It requires deciding what you are counting and leaving it alone long enough for the trend to be real.
Where to start if your shopping cart abandonment rate looks wrong
If your shopping cart abandonment rate sits outside the 55% to 84% range of the published abandonment rates, suspect the measurement before the checkout process. If it sits inside the range and has moved, look at traffic mix and the three step rates before anyone redesigns anything.
If the suspicion is that paid media is filling your cart with the wrong people, that is a question an account audit answers quickly: campaign objectives, audience composition, feed quality and which conversion event each campaign is actually bidding toward. We do that as a free ad audit across Google and Meta, and the output is a list of what is buying carts rather than orders.
To size the prize before you start, the ecommerce ROAS calculator will show what a given lift in completed orders is worth against your margin, and the rest of the metrics library covers the numbers this one feeds. If the fix turns out to be in the account rather than the checkout, our Google Ads management and Meta advertising work for DTC and ecommerce brands is built around exactly that distinction.