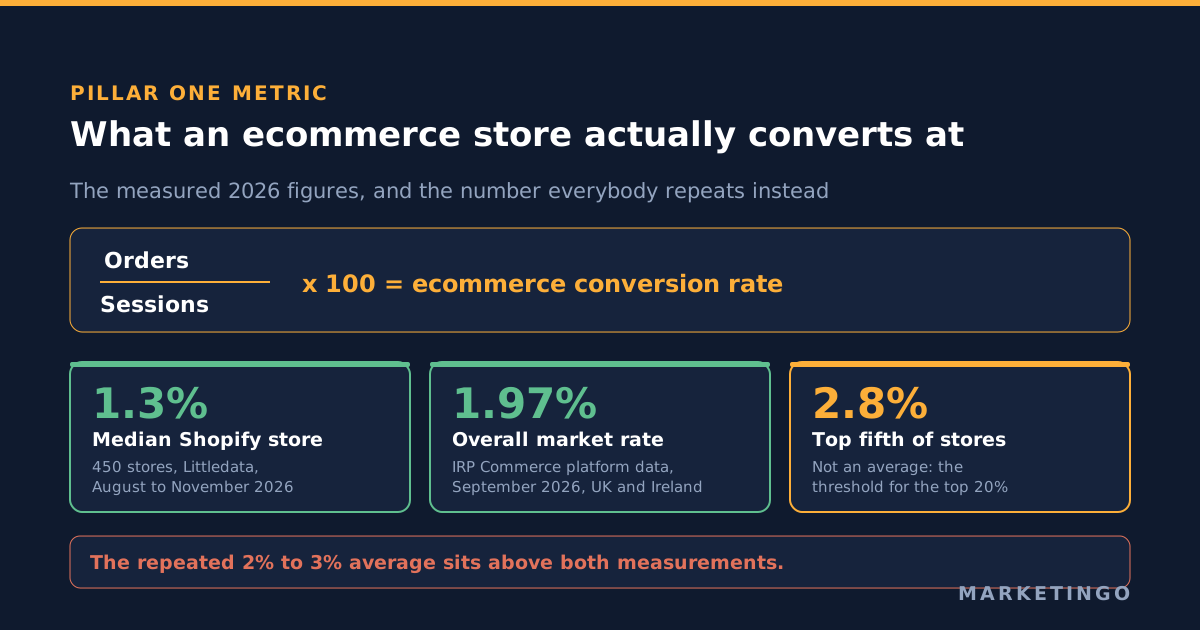
Ecommerce conversion rate is the share of visits that end in a purchase: orders divided by sessions, multiplied by 100. A store with 40,000 sessions and 520 orders converts at 1.3 percent. The measured 2026 benchmarks put the typical store between 1.3 and 2 percent, well below the 2 to 3 percent figure repeated across most of the results page you arrived from.
That gap is the whole subject of this article. It is not that one source is wrong. It is that the published averages count different things in the denominator, cover different countries, and in two cases average studies that are almost two decades old. Before you compare your number to anyone's benchmark, you need to know which number you are holding.
The formula, and the four denominators that make benchmarks incompatible
The arithmetic is not in dispute:
Ecommerce conversion rate = (orders / sessions) x 100
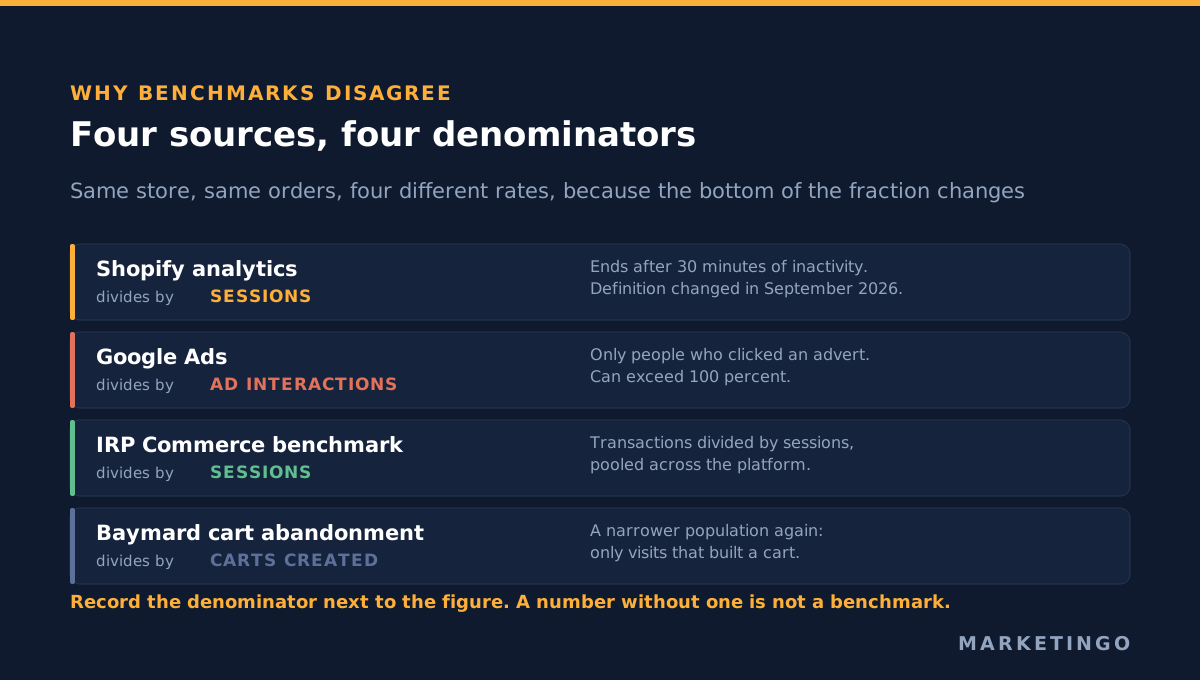
What is in dispute is what counts as a session, and whether the denominator is sessions at all. Four sources that a store owner is likely to read in the same afternoon use four different ones.
| Source | What it divides by | Stated in |
|---|---|---|
| Shopify analytics | Sessions, ending after 30 minutes of inactivity | Shopify Help Center |
| Google Ads | Ad interactions, not sessions | Google Ads Help |
| IRP Commerce market data | Sessions, as transactions divided by sessions | IRP Commerce |
| Baymard Institute cart abandonment | Carts created | Baymard Institute |
Three consequences follow, and all three show up in real accounts.
Google Ads reports a rate that is not comparable to your Shopify rate at all. Google defines its conversion rate as "the average number of conversions per ad interaction, shown as a percentage", and its help page notes the figure can exceed 100 percent when a single interaction is credited with more than one conversion action. A paid search campaign showing a 6 percent conversion rate and a storefront showing 1.4 percent are not contradicting each other. They are answering different questions about different populations.
Shopify changed what a session is during 2026. Its session measurement update rolled out in late September 2026 and moved sessions from ending at midnight Coordinated Universal Time to ending after 30 minutes of inactivity, began counting some sessions that included no page view, such as a shopper going straight to checkout from a cart link, and filtered identified bot sessions out by default. Shopify states that the change does not reprocess historical data. If your conversion rate stepped up or down in early October without a matching change in orders, that is the first place to look, and a year-on-year comparison that spans the change is comparing two different metrics.
Even Shopify's own documentation is not internally consistent about it. The behaviour reports page introduces the metric as "the percentage of online store visitors that make a purchase" in one sentence and defines the column as the percentage of sessions in another. Visitors and sessions are not the same denominator, and a store with a high return rate will see a materially different number depending on which one is used.
Ecommerce conversion rate benchmarks by industry for 2026
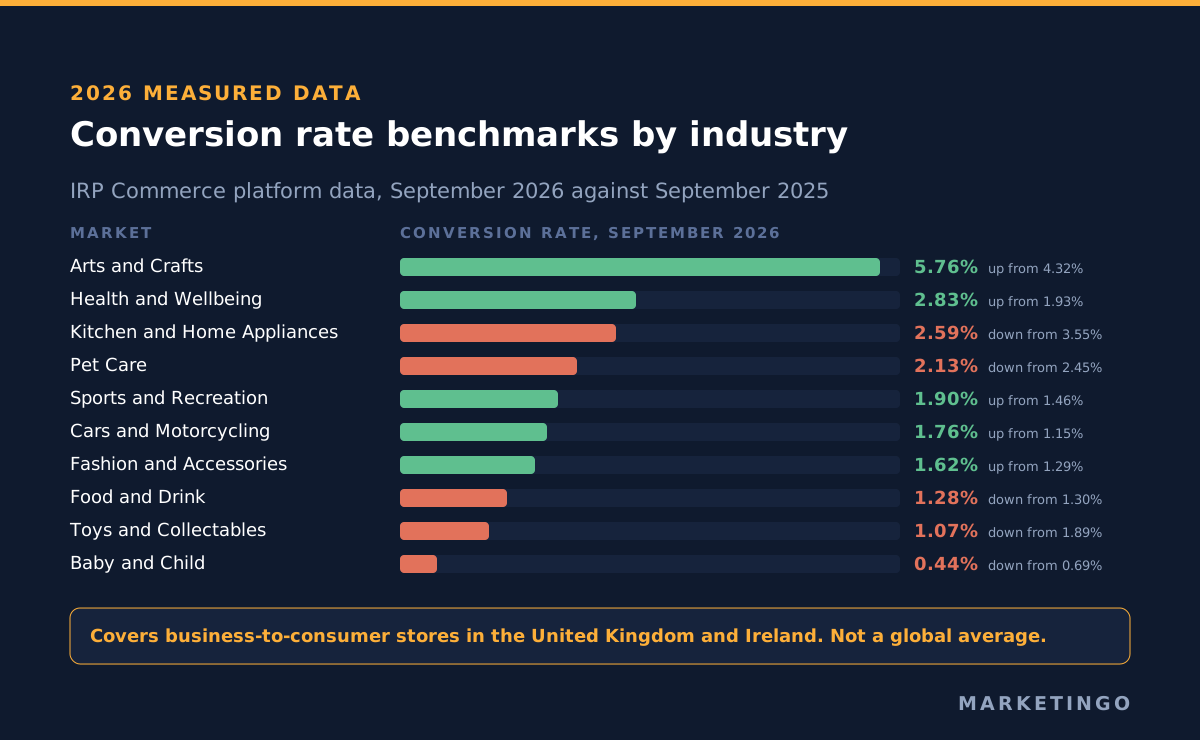
There is no single global average ecommerce conversion rate, and any page offering one without naming the countries it covers has guessed. What exists is a handful of industry benchmarks built from real platform data, each covering a particular population of ecommerce stores. Two of them publish dated figures from their own platforms rather than recycling a number from elsewhere, and they disagree in an instructive way.
IRP Commerce, which calculates benchmarks from trading data recorded inside its own platform, reports an overall market conversion rate of 1.97 percent for September 2026, against 1.68 percent in September 2025. Its stated formula is transactions divided by sessions, multiplied by 100, using a first-party last-click attribution model. One caveat that almost no article quoting IRP passes on: its market data centre states that it currently covers business-to-consumer ecommerce in Great Britain, Northern Ireland and Ireland. It is not a global average, and it should not be quoted as one.
Its September 2026 figures by market:
| Market | Sep 2026 | Sep 2025 |
|---|---|---|
| Arts and Crafts | 5.76% | 4.32% |
| Health and Wellbeing | 2.83% | 1.93% |
| Kitchen and Home Appliances | 2.59% | 3.55% |
| Pet Care | 2.13% | 2.45% |
| Sports and Recreation | 1.90% | 1.46% |
| Cars and Motorcycling | 1.76% | 1.15% |
| Fashion, Clothing and Accessories | 1.62% | 1.29% |
| Food and Drink | 1.28% | 1.30% |
| Toys, Games and Collectables | 1.07% | 1.89% |
| Baby and Child | 0.44% | 0.69% |
Littledata publishes a separate benchmark from 450 Shopify stores over the 90 days from 10 August to 7 November 2026, generated on 11 November 2026. Its median store converts at 1.3 percent. The spread matters more than the median: a store needs 2.8 percent to sit in the top fifth and 3.6 percent to sit in the top tenth, while the bottom fifth sits at 0.5 percent and below. Its reported industry medians are beauty and skincare 2.8 percent, health and supplements 2.6 percent, food and beverage 2.1 percent, fashion and apparel 1.1 percent, home and furniture 1.1 percent.
Read those two sources together and the method does most of the work. Littledata ranks each store once and takes the median of the stores, so a shop with a thousand sessions counts for exactly as much as one with a million. IRP pools trading data across its platform, which lets large merchants pull the figure. Littledata also excludes any store below 1,000 sessions or 90 purchases in the window and trims anything outside 0.05 to 20 percent as implausible. Neither approach is wrong. They are measuring different populations, and the 0.7 point gap between them is mostly that.
The "two to three percent" figure does not survive its sources
The most repeated claim in this category is that the average ecommerce conversion rate is 2 to 3 percent. It appears on most of the pages ranking for this query, almost always without a source, and it is doing real damage to budget planning.
Both of the 2026 measurements above come in under it. IRP's whole-market figure is 1.97 percent. Littledata's median is 1.3 percent, and 2.8 percent is its threshold for the top fifth of stores, not its average. A store converting at 2 percent is not lagging a 2 to 3 percent norm. On the Littledata distribution it is comfortably above the midpoint.
The practical cost of the wrong anchor is that it gets used as a forecast. A media plan built on "we will hold 2.5 percent once the account is tuned" prices traffic the account cannot afford. If the honest expectation is 1.3 to 2 percent, the allowable cost per click falls by a third or more, and the campaigns you can profitably run change with it. This is why conversion rate belongs in the model before the budget rather than after, alongside average order value and the break-even return on ad spend it sets.
Conversion rate benchmarks by device: the gap runs the other way
The second claim worth checking is that mobile converts worse than desktop. It is stated as settled almost everywhere, and in the most recent store-level data it is not.
Littledata's device figures from the same 450-store sample put the mobile median at 1.5 percent and the desktop median at 1.2 percent. Mobile is ahead at the median. Desktop pulls ahead only at the top of the distribution, where the strongest tenth of stores reach 4.7 percent on desktop against 4.3 percent on mobile.
Two reasons to treat any device comparison carefully before you act on it. A shopper who browses on a phone and buys on a laptop puts the session on one device and the order on the other, so part of every device gap is attribution rather than behaviour. And device splits are usually quoted with no denominator attached at all, which is the same problem one level down. The useful move is not to find a better published device benchmark. It is to read your own split, check whether your mobile sessions and mobile orders are even being counted by the same tool, and treat an unexplained gap as a measurement question first.
The 70 percent cart abandonment figure, and what it is an average of
Baymard Institute publishes the number everyone cites: a 70.22 percent average documented cart abandonment rate, last updated 28 October 2026. Its formula is stated plainly as one minus completed purchases divided by carts created, multiplied by 100, and that denominator of carts created is a fourth population again, narrower than sessions.
The part that gets dropped in retelling is how the figure is built. Baymard describes it as the unweighted average of 50 studies published between 2006 and 2025, with individual rates in those studies ranging from 55 to 84 percent. An unweighted mean across two decades gives a study from 2007 the same weight as one from 2024, and the 29-point spread between the lowest and highest study is wider than most of the differences people use the figure to argue about.
None of that makes it useless. It is the best-documented number in the category, and Baymard is unusually open about its method, which is exactly why it is worth quoting correctly. It is a well-sourced long-run average, not a current measurement of your checkout, and your own cart abandonment rate against your own cart definition is the one that should drive decisions.
How to calculate conversion rate in Google Analytics and Shopify
Most arguments about whether a store has a good conversion rate turn out to be arguments about which tool produced the figure. Three practical points settle most of them.
In Shopify analytics, the online store conversion rate is calculated from sessions, and the three-step breakdown on the same report gives you sessions that added to cart, sessions that reached checkout and sessions that completed checkout as shares of total sessions. That breakdown is the fastest decomposition available to most stores and it costs nothing to read.
In Google Analytics 4, the first thing to establish is your denominator, because the platform can express the same purchases against sessions or against users. Those produce different numbers from identical ecommerce sales, and the gap widens the more your traffic returns before buying. Decide which one your reporting uses, write it down, and do not let it drift between quarters. The same applies to any benchmark you compare yourself against: Littledata's figures, for example, are built from Google Analytics 4 session data, so they are comparable to a session-based reading of your own store and not to a user-based one.
In your ad platforms, treat the reported conversion rate as a campaign diagnostic rather than a store metric. It answers how well a particular slice of ecommerce traffic converted, which is useful for deciding where to put budget, and it is not the number to put in a board report as the store's performance.
One habit worth building: when you compare conversion across periods, segment by landing page type as well. Product page conversion behaves differently from category and homepage entries, and a shift in the mix of where paid traffic lands can move the overall conversion rate without any change in how well the store sells.
Break the rate into three rates before you try to move it
A single conversion rate tells you something is wrong and nothing about where. Decomposed, it tells you which team owns the problem:
- Add-to-cart rate. Sessions that add at least one item, divided by sessions. This is the product and traffic question: did the visitor find something they wanted at a price they accepted.
- Cart-to-checkout rate. Sessions reaching checkout, divided by sessions that added to cart. Shipping cost, delivery timing and account creation decide most of this one.
- Checkout completion rate. Sessions completing purchase, divided by sessions reaching checkout. Payment options, form length and error handling decide this one.
Multiply the three and you get the conversion rate back. The reason to hold them separately is that they move for unrelated reasons and respond to unrelated work. A 1.1 percent store with a healthy add-to-cart rate and a weak checkout completion rate has a checkout problem that no amount of bid adjustment will fix. A 1.1 percent store with a weak add-to-cart rate has a traffic or offer problem, and that one is squarely a paid media problem.
Where conversion rate optimization ends and paid media begins
This distinction is worth being blunt about, because the category routinely blurs it.
Conversion rate optimization, usually shortened to CRO, is the discipline that works on the store itself: page speed, layout, product page content, checkout steps, payment options including wallets such as Google Pay and Apple Pay, form design and testing. Most conversion rate optimization tips you will find attached to benchmark articles belong to that discipline, and most of them are sound. They are also someone else's work. Paid media sits on the other side of the line, and conflating the two is how stores end up paying an advertising agency to improve conversion rates it has no mechanism to touch.
A paid media account moves conversion rate by changing who arrives and what they were promised. The levers that work are narrowing the query set so fewer browsers and more buyers arrive, which is the negative keyword and search term work; matching the ad to the page the shopper lands on, so the product they clicked is the product they see; the shopping feed, where title, image, price and availability decide both which queries you appear for and what the shopper expects; audience and exclusion settings, particularly suppressing recent purchasers from prospecting; and the offer as it is presented in the advert, including shipping threshold and delivery promise. Those are Google Ads and feed decisions, and they are real: pushing a store's traffic mix toward buyer-intent queries often moves the blended rate more than any on-site change made in the same quarter.
What a paid media account does not move is page speed, checkout flow, payment method coverage, form design or product photography. MarketinGO runs paid media only, so when an audit finds the problem sitting in checkout, the honest output is a diagnosis and a handoff to whoever owns the storefront, not a proposal. An agency that offers to boost conversion rates without asking which of the three component rates is broken is selling before diagnosing.
The practical test for an ecommerce business deciding where to spend the next quarter: if your add-to-cart rate is healthy and the drop happens later, conversion rate optimization work on the ecommerce website will return more than any bidding change. If shoppers are not adding to cart in the first place, you have an ecommerce traffic problem, and that is where advertising work produces real conversion lift.
For stores where the traffic side is the constraint, that work is the core of what an ecommerce and direct-to-consumer engagement does, and the dental supplies ecommerce case study shows the shape of it on a real account.
Conversion rate is half of the number your bids need
On its own, a conversion rate cannot price a click. Paired with average order value it becomes revenue per session, which can:
Revenue per session = conversion rate x average order value
A store at 1.3 percent and a 90 dollar average order value earns 1.17 dollars per session. One at 0.9 percent and a 180 dollar average order value earns 1.62 dollars per session, and can afford meaningfully more for the same traffic despite the lower conversion rate. This is why ranking stores by conversion rate alone misleads, and why a conversion rate improvement that comes from discounting can leave the account worse off once margin is applied.
Put your gross margin on top and you have the figure that actually sets the ceiling on what a click is worth. The ecommerce return on ad spend calculator does that arithmetic, and the return on ad spend formula article covers the version of the metric your bids can use. For businesses selling to other businesses rather than to consumers, the equivalent chain runs through lead conversion rate and the lead generation return on investment calculator instead.
How to measure it so your number is comparable next quarter
Four habits make the difference between a metric you can act on and one you argue about:
Write the denominator down. Record it next to the figure: sessions, users or carts, and which tool produced it. A number without its denominator is not a benchmark, it is a rumour.
Pick one system of record and keep it. Shopify, your analytics platform and your ad platforms will never agree, and reconciling them monthly is wasted time. Choose the one closest to money, usually the storefront, and use the others for direction rather than level.
Date your comparisons against platform changes. Shopify's September 2026 session change is the current example, and historical data was not reprocessed. Any trend line crossing a measurement change needs a note on the chart.
Segment before you benchmark. New against returning visitors, paid against organic, mobile against desktop, and by product category. A blended rate conceals the only differences worth acting on, and a store comparing its blended rate to a published median learns almost nothing.
More metric articles that feed the same model sit on the resources hub, including customer acquisition cost for the other side of the equation.
Where to start if your rate is below the benchmark
Run the decomposition first. Pull add-to-cart rate, cart-to-checkout rate and checkout completion rate for the last 90 days, and find which of the three is furthest from where it should be. If it is the first one, the problem is in the traffic and the offer, and that is work an ad account can do. If it is the second or third, no bidding change will reach it, and you will save a quarter by knowing that now.
If the traffic side is the suspect, a free advertising account audit is the fastest way to find out. We read the search terms, the feed and the campaign structure against what your conversion rate by query actually looks like, and tell you which of the three rates your spend is realistically able to move. If the answer is none of them, we say so, because paid media is the only thing we sell and there is no point selling it into a checkout problem. The same diagnosis runs across Meta advertising accounts where prospecting and retargeting conversion rates need separating before either figure means anything.