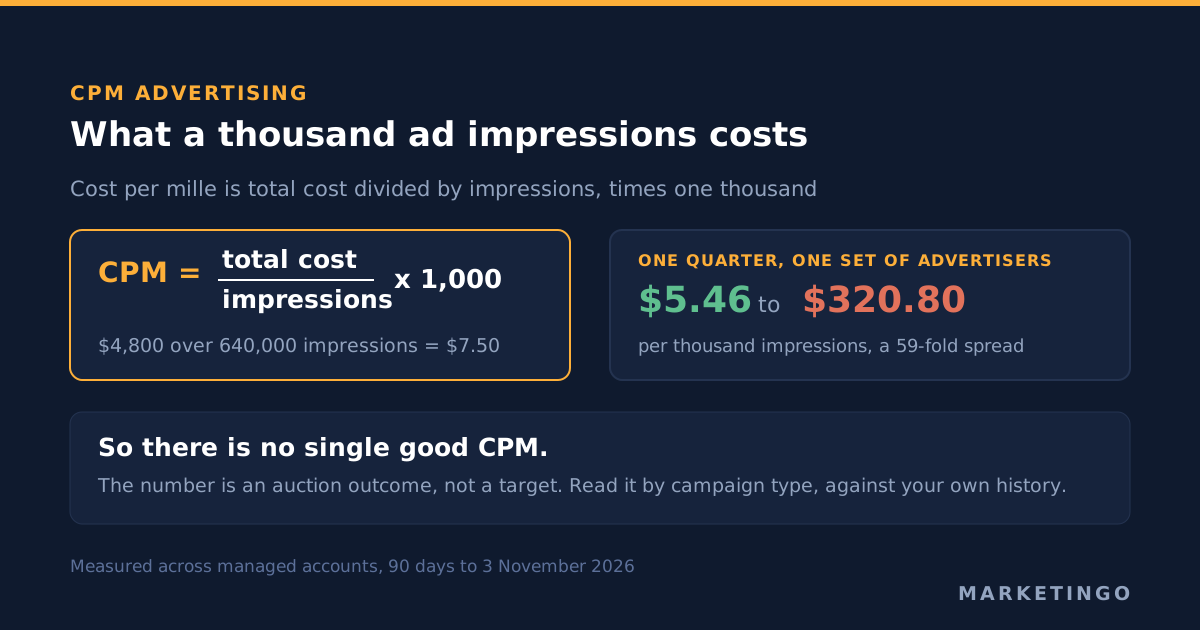
CPM advertising means paying for impressions instead of clicks or conversions. CPM stands for cost per mille, from the Latin for thousand, so a CPM of $12 means you pay $12 each time your ad is shown one thousand times. The formula is total cost divided by the number of impressions, multiplied by 1,000. That is the whole metric, and almost everything useful about it sits in what the denominator does or does not count.
How to calculate CPM, in three forms
Divide what you spent by the impressions you received, then multiply by one thousand.
CPM = (total cost / impressions) × 1,000
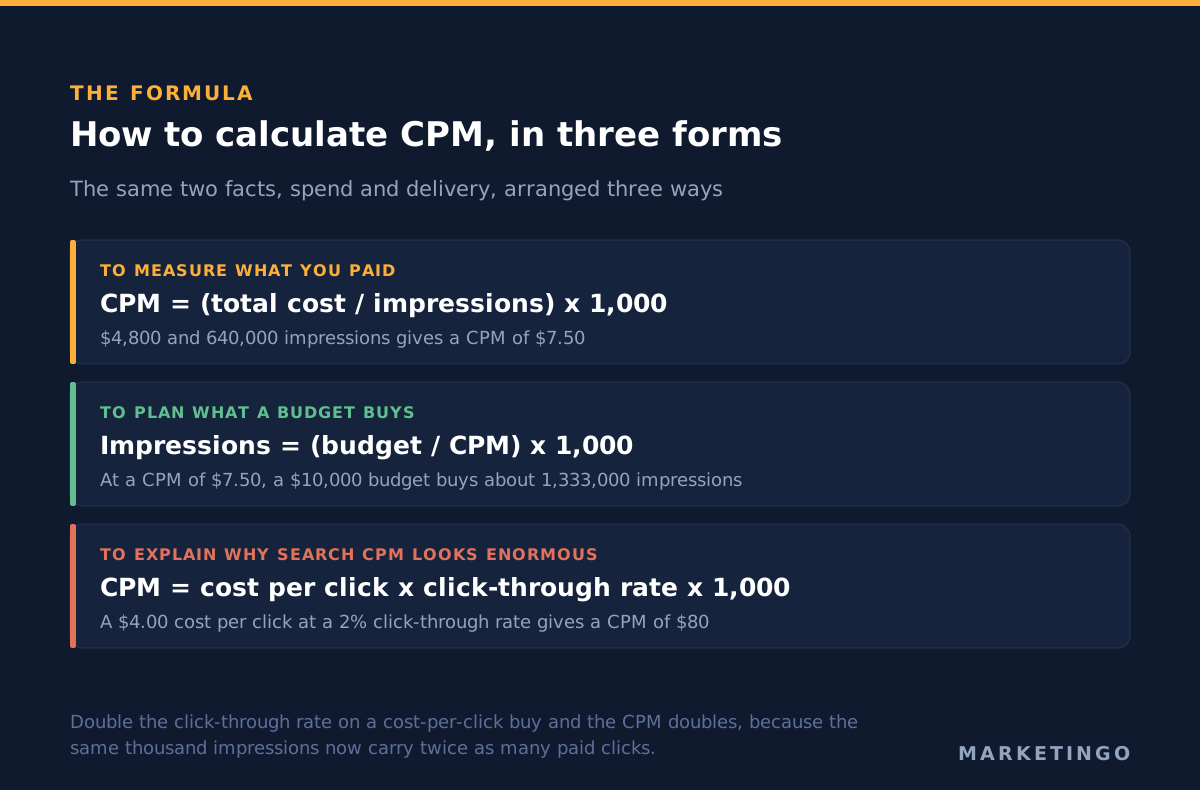
An ad campaign that spent $4,800 and served 640,000 impressions has a CPM of $7.50. Four thousand eight hundred divided by 640,000 is 0.0075, and 0.0075 multiplied by one thousand is 7.50.
Run it backwards when you are planning. At a CPM of $7.50, a $10,000 budget buys roughly 1,333,000 ad impressions, because 10,000 divided by 7.50 and multiplied by one thousand is 1,333,333.
The third form is the one most advertisers never write down, and it explains the numbers in the next section. Cost per thousand impressions, cost per click and click-through rate (CTR) are three arrangements of the same two facts, spend and delivery:
CPM = cost per click × click-through rate × 1,000
An ad with a $4.00 cost per click and a 2% click-through rate carries a CPM of $80. Hold the cost per click still, double the click-through rate to 4%, and the CPM doubles to $160. On a cost-per-click buy, a better click-through rate makes your cost per thousand impressions worse, because you are paying for more clicks out of the same thousand ad views. Anyone who treats CPM as a single measure of efficiency across a whole account is going to find that result baffling.
What a good CPM is, measured in live accounts
Here is cost per thousand impressions computed from the accounts we manage, over the 90 days ending 3 November 2026. Only accounts billed in United States dollars are included, so no currency conversion is involved, and every figure is total cost divided by total impressions for that slice. Google is broken out by campaign type because that is where the variation lives.
| Platform and campaign type | Impressions | Cost | CPM |
|---|---|---|---|
| Google Ads, Search | 360,699 | $115,713 | $320.80 |
| Google Ads, Performance Max | 34,898 | $1,479 | $42.39 |
| Google Ads, Shopping | 264,077 | $6,522 | $24.70 |
| Google Ads, Display | 61,224 | $1,429 | $23.34 |
| Google Ads, Demand Gen | 406,298 | $2,218 | $5.46 |
| Google Ads, all campaign types | 1,127,196 | $127,362 | $112.99 |
| Microsoft Advertising, search | 309,984 | $18,134 | $58.50 |
| Meta, all placements | 1,427,999 | $24,663 | $17.27 |
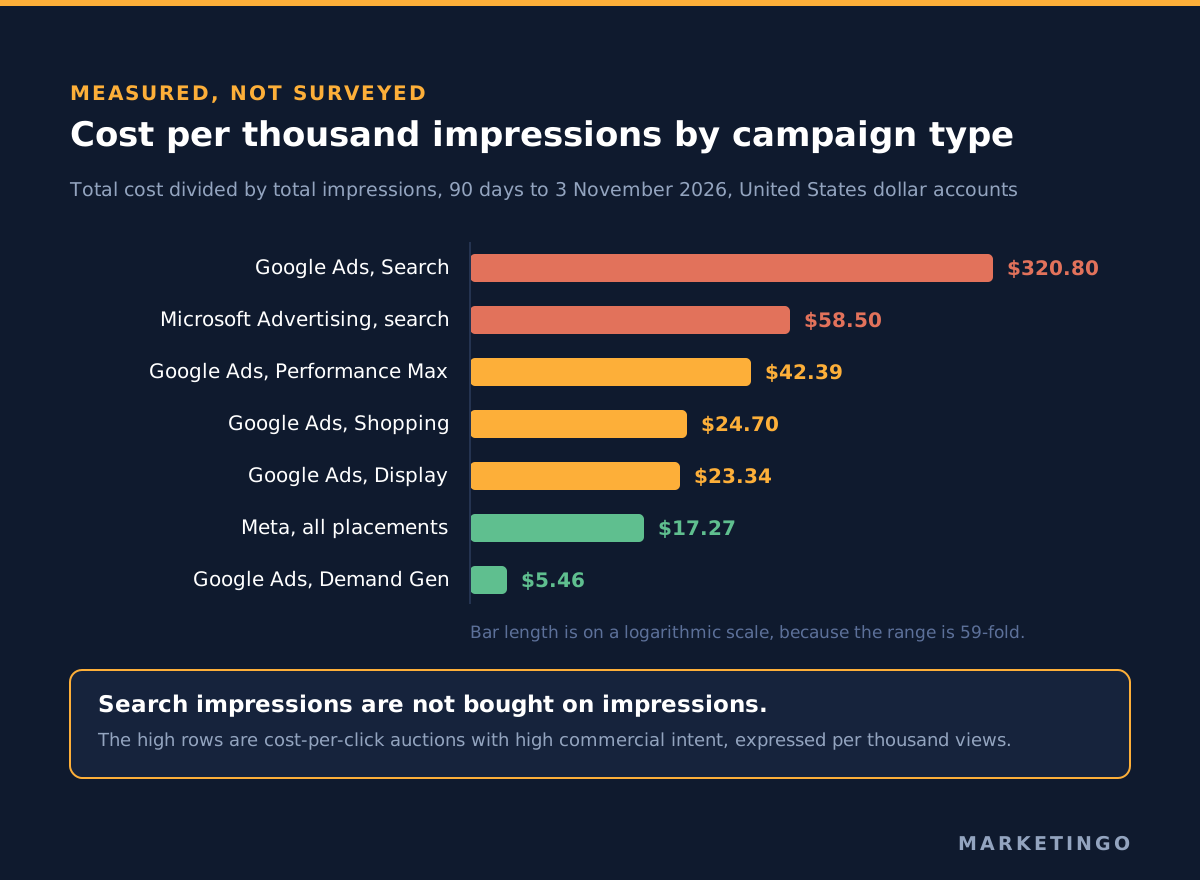
Read the top and bottom rows together. Inside one platform, one quarter and one set of advertisers, the cost of a thousand impressions moved from $5.46 to $320.80. That is a 59-fold spread, and nothing about the advertisers changed between those two rows. What changed was where the ad ran and what the advertiser was paying for.
The spread inside each platform is nearly as wide as the spread between platforms. On Microsoft Advertising the three accounts ran at $30.51, $34.71 and $126.07, the highest being a business-to-business software company buying a small volume of expensive commercial-intent search terms. On Meta the three accounts ran at $7.05 for a consumer ecommerce brand, $22.81 for a food and beverage brand and $30.35 for a home improvement installer selling an installed product to homeowners. The Meta figures are a cleaner comparison than the Google ones, because Meta charges by impression natively, so the number reflects what the auction actually cost rather than how often people clicked.
Why no published average CPM is worth quoting
Search for a CPM benchmark and you will find plenty of numbers. Almost none of them survive a check.
Start with the most cited benchmark set in paid search. LocaliQ publishes search advertising benchmarks drawn from thousands of its customers' campaigns, last updated 1 June 2026, and it reports an average cost per click of $5.42, an average click-through rate of 6.64%, an average cost per lead of $66.69 and an average conversion rate of 8.18% across 24 business categories. It does not publish a cost per thousand impressions figure at all, for any industry. The single most widely quoted source of paid search averages declines to average this particular marketing metric, and the table above shows why. An average built across campaign types mixes a $5.46 row with a $320.80 row and produces a number that describes no real account.
The second reason is the auction. CPM is an outcome of what other advertisers were willing to pay to reach the same target audience in the same country in the same week, crossed with the ad format and the placement. Change the geography, the season, the audience size or the creative and the number moves. A CPM quoted without the country, the month, the platform, the campaign type and the audience is not a benchmark. It is a decoration.
The third reason is that most published CPM rates are written for the other side of the trade. Publishers, ad networks and affiliate marketing sites quote CPM as revenue earned per thousand ad views on their own inventory, which is a different number with the same name. If a figure comes from a page explaining how to raise your CPM, it is telling a publisher how to earn more, not telling you what buying should cost.
An impression is not a person
The m in CPM is impressions, not people. Those are different quantities, and the gap between them is measured and reported on every platform that sells on impressions.
Take the home improvement account above. Over those 90 days its Meta activity served 549,586 impressions to 226,014 people, an average frequency of 2.43. Its CPM was $30.35. Its cost per thousand people reached was $73.81, because $16,682 of spend divided by 226,014 people and multiplied by one thousand is 73.81. Same spend, same campaign, two numbers that differ by a factor of 2.4, and only one of them answers "what does it cost to reach a thousand humans".
Meta reports both figures side by side in its reporting interface, cost per thousand impressions and cost per thousand people reached. If a campaign exists for brand awareness rather than clicks, the second one is the number that belongs in the plan, and the frequency between them is the thing to argue about. Three exposures to 226,000 people and one exposure to 678,000 people cost the same and do different work.
An impression is not always a viewable impression
The denominator has a second problem: an impression is a served ad, and a served ad is not necessarily an ad anyone could see.
The industry definition of a seen ad comes from the Media Rating Council. Its viewable ad impression guidelines, the version dated 18 August 2015, require for a display or banner ad that "Greater than or equal to 50% of the pixels in the advertisement were on an in-focus browser tab on the viewable space of the browser page" and that the time this condition holds is "greater than or equal to one continuous second, post ad render". Video needs "2 continuous seconds" at the same pixel threshold. Very large display units, at or above 242,500 pixels, qualify at 30% of pixels for one continuous second.
Google applies the same thresholds. Its documentation states that "An ad is counted as 'viewable' when 50 percent of your ad shows on screen for 1 second or longer for Display ads, or plays continuously for 2 seconds or longer for video ads", and that viewability is measured by Active View on Display Network websites. Google also sells against that definition: with viewable CPM "you bid on 1,000 viewable impressions and you pay for impressions that are measured as viewable". The same page notes that not every served impression can even be assessed, defining measurable impressions as "the number of impressions that were able to be measured; not all impressions that are served are able to be measured".
So a CPM figure and a viewable CPM figure for the same display advertising campaign are two different ratios with two different denominators, and the second is always the higher number. Comparing a viewable CPM on one platform against a served-impression CPM on another is the most common way advertisers talk themselves into the wrong media decision.
Where you actually buy on CPM, platform by platform
The CPM model is a pricing model before it is a performance measure, and it is not offered everywhere. Where it is offered has narrowed.
On Google Ads, target CPM is a video bid strategy. Google's own documentation says "Target cost-per-thousand impressions is available for video campaigns in Google Ads", and describes a target CPM bid as "how much on average you're willing to pay every thousand times your ad is shown". For the Display Network, viewable CPM is the impression-based option, where the bid buys one thousand impressions that Google measured as viewable, and Google's page on it states plainly that "Max. CPM is no longer available as a bid strategy". Search campaigns cannot be bought on impressions at all, which is exactly why the $320.80 row exists: that is not a CPM bid, it is the arithmetic consequence of a cost-per-click auction with high commercial intent. Our article on Google Ads costs covers the cost-per-click side of the same account set.
On Meta, impressions are the native billing event for most objectives, so you pay for every thousand impressions delivered and the reported CPM is close to the thing you are actually buying. Our breakdown of Facebook and Meta advertising costs goes through the objectives in detail.
On Microsoft Advertising, impression pricing applies to audience inventory rather than search. Microsoft states that "Cost per 1,000 impressions, also known as CPM, means you pay based on how often your ad is shown" and that "Audience ads, including display and native advertising, use CPC or CPM pricing depending on the campaign goal", on its pricing and cost control page. Microsoft measures viewability through Integral Ad Science rather than billing on it, per its display ad products page.
On LinkedIn, impression bidding is available for awareness and engagement objectives, and in business-to-business buying it tends to produce the highest cost per thousand impressions of the four platforms. We have not put a LinkedIn figure in the table above, because we could not compute it from our own accounts for the same 90-day window as the rest, and filling the row from an aggregator would defeat the point of the table. Our article on LinkedIn advertising costs covers what we can measure there.
The three jobs CPM does well
A delivery diagnostic. A CPM that jumps 40% in a week with no change to the creative or the budget is telling you something: the audience shrank, a competitor arrived, a seasonal auction tightened, or the campaign drifted onto more expensive placements. It is the fastest read available on whether a change in campaign performance came from the auction or from your own funnel. This is where the metric earns its keep.
Reach planning. Budget divided by CPM gives impressions; impressions divided by your chosen frequency gives people. That chain is how you find out whether a $25,000 awareness budget reaches a meaningful share of a target audience three times or a trivial share of it twelve times, before you spend it.
Competitive pressure. Because CPM is the price of attention rather than the price of a response, it moves with demand for the same inventory. Demand for digital ads is seasonal, so rising CPM rates across a whole account in November, with stable conversion rates, is a market signal rather than a performance problem.
The one job CPM does badly: being a target
Set a CPM target and you will hit it. The method is always the same: move spend to cheaper inventory, broader audiences and lower-attention placements, where a thousand ad impressions are easy to buy and nobody who sees them was going to act.
That trade is visible in the table above. Demand Gen bought impressions at $5.46 and Search bought them at $320.80, and across those same accounts over those same 90 days the expensive thousand impressions produced the overwhelming majority of the conversions. The cheap thousand is rarely the valuable thousand. A CPM campaign that you optimize toward a lower impression cost will win that contest every time, by buying attention nobody wanted. A low CPM with a rising cost per acquisition (CPA) is not an efficiency gain, it is a slow leak.
The practical rule we use: CPM is a diagnostic input, never a key performance indicator. The number that goes in the dashboard is cost per acquisition, cost per lead or return on ad spend, with CPM sitting underneath as the explanation when one of those moves. In one home improvement account we manage, pushing on the quality of the lead form and the geography rather than on impression costs took cost per lead from $47.01 to $32.99 while lead form volume rose from 1,090 to 1,360. Cost per thousand impressions was not the lever, and if it had been managed as the target the account would have moved the wrong way.
If you want the arithmetic that decides which direction a cost change should push your bids, break-even ROAS is the article for ecommerce and cost per lead is the one for lead generation.
How to read your own CPM in four steps
- Pull the number by campaign type, never at account level. An account-level CPM averages incompatible things, exactly as a published industry average does.
- Pull it beside cost per click and click-through rate for the same rows. When all three move together you are looking at a delivery change; when CPM moves alone you are looking at the auction.
- On impression-bought campaigns, pull cost per thousand people reached and frequency next to it. If frequency is climbing while reach is flat, the audience is too small for the budget.
- On display advertising, pull viewable impressions and the viewable rate. A respectable CPM on inventory with a poor viewable rate is a worse buy than a higher CPM on inventory people actually see.
Get a second read on what your impressions cost
If your cost per thousand impressions has moved and you cannot tell whether the cause is the auction, the audience or the creative, that is a question with a definite answer sitting in the account. Our free ad audit is a structured review of exactly that: where the money goes by campaign type, which placements are buying attention and which are buying inventory, and what the impression costs imply for your bids.
We run paid media only, across Google Ads, Meta, LinkedIn and Microsoft Advertising, which is why the numbers on this page come from accounts rather than from a survey. If you sell physical products, our work in ecommerce and direct-to-consumer is the closest comparison, and the ecommerce ROAS calculator will turn an impression cost into a margin answer. For lead generation, the lead generation return on investment calculator does the same job in cost per lead terms. Any digital marketing agency should be able to show you this breakdown for your own account in an afternoon.