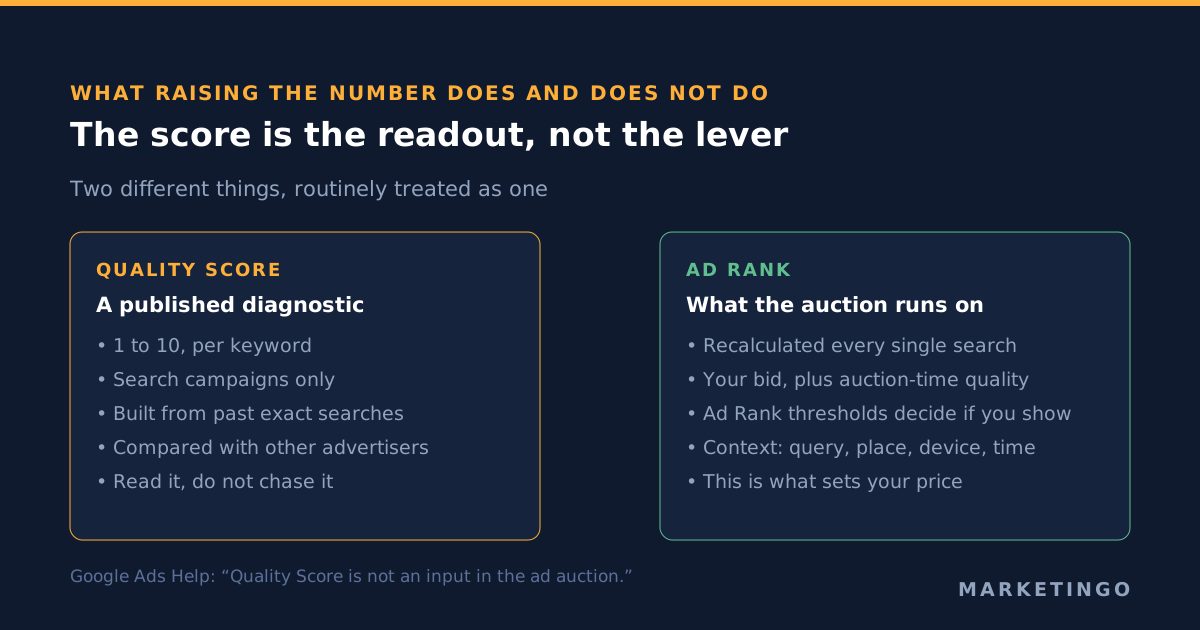
Google Ads Quality Score is a diagnostic number from 1 to 10, reported for each keyword in a Search campaign, built from three component ratings: expected clickthrough rate, ad relevance and landing page experience. Each component is scored against other advertisers who appeared for the same search over the previous 90 days. Google states that the score is not an input in the ad auction, so raising the number is not the goal. Reading it is.
That last point is where most Quality Score advice goes wrong, and it is worth being precise about why, because the practical consequences are large.
What Quality Score in Google Ads actually reports
Google's help page About Quality Score for Search campaigns describes it as "a diagnostic tool meant to give you a sense of how well your ad quality compares to other advertisers," measured "on a scale from 1-10 and available at the keyword level."
Four properties of that definition matter when you sit down to work with it.
It is comparative, not absolute. The three components are each rated "Above average," "Average," or "Below average" against advertisers whose ads showed for the exact same search over the last 90 days. A keyword rated "Below average" on ad relevance is not failing a published standard. It is behind the other advertisers who bid on that search, and the number can move because they changed something rather than because you did.
It is historical. The score is built from accumulated impressions on exact searches for that keyword. It describes what has already happened, which is why the column often lags a fix by days rather than reflecting it the same afternoon.
It lives at the keyword level, inside Search campaigns. There is no Quality Score column for Performance Max, Shopping, Demand Gen or Display, because the number is built from exact-search history that those campaign types do not produce in the same form.
And it is explicitly not a target. The same page says Quality Score "is not a key performance indicator and should not be optimized or aggregated with the rest of your data." The account-wide average Quality Score that appears in so many reporting templates is a figure Google's own documentation tells you not to construct.
The Quality Score formula, and why Google has never published one
"Quality score formula" is one of the most searched phrases attached to this metric, and the honest answer is that there is no published formula. Google names the three core components of Quality Score and states that the score is measured on a scale of 1 to 10. The published detail stops there. Google does not say how the three are weighted, what separates Above average from Average, or how many impressions a keyword needs before a rating settles. Any "complete Quality Score formula" you find is a reconstruction by somebody outside Google, and the quality score algorithm is not something you can compute against.
What you can rely on is narrower and more useful. Quality Score in Google Ads is per keyword, so a keyword Quality Score belongs to that keyword and not to the ad group or the campaign around it. It is built from the history of exact searches for that keyword. It is comparative, measured against advertisers whose ads appeared for the same search in the previous 90 days. And it is a rating of how Google evaluates ad quality after the fact, not a live calculation you can watch respond.
That is why the practical unit of work is the component rating rather than the composite digit. You cannot reverse-engineer the arithmetic, and you do not need to. Each of the three components names a specific thing to go and look at.
The sentence most Quality Score advice steps over
Search for a Quality Score guide and you will find a table mapping the score to a percentage saving on cost per click. A 10 earns a large discount, a 4 a penalty, and the arithmetic is presented as a mechanism. The framing is always the same: Google rewards ads with higher quality scores, and the Quality Score directly impacts what you pay, so a high Google Quality Score can lead to a lower cost per click and a better ad position.
Google's help page for Quality Score contains this sentence: "Quality Score is not an input in the ad auction."
Those tables therefore attribute to the reported 1-to-10 figure an effect the reported figure does not have. A keyword with a lower quality score is not being charged a surcharge keyed to that number. They are not describing a dial you can turn. At best they are describing a correlation, and reading a correlation as a lever is how an account ends up with a campaign restructured around a diagnostic column while its cost per acquired customer stays where it was.
The underlying intuition is not wrong. Quality does affect what you pay. Google says so directly on the Ad Rank page: "Higher quality ads can often lead to lower CPCs. That means you pay less per click when your ads are higher quality." The error is one of mechanism. Ad quality is assessed at auction time, for that specific search, by signals that are not the number in your Quality Score column. The column is a summary of those signals, published after the fact, for you to read.
Treat it that way and it becomes useful. Treat it as the thing being measured by the auction and you will spend weeks optimizing a report.
What the auction actually weighs
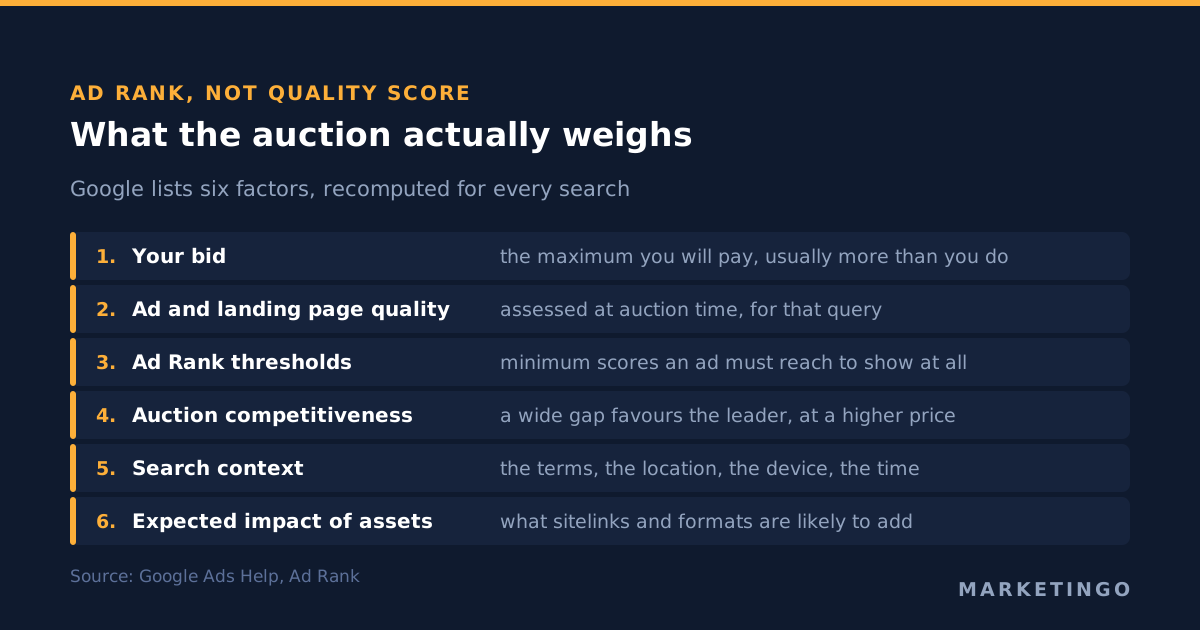
Google states that "At a high level, Ad Rank scores are based on 6 factors," and names them: your bid; ad and landing page quality; Ad Rank thresholds, which are the minimum scores an ad must reach to show at all; auction competitiveness, where a close gap between two advertisers gives them similar chances and a wide gap favours the leader at a higher cost per click; search context, including the search terms, location, device and time of day; and the expected impact of your ad assets and formats, such as sitelinks.
Two things follow that change how you work.
Ad Rank is recalculated for every search. Google describes it as including "auction-time quality that can include auction-time measurements like expected CTR," alongside ad relevance and landing page experience. Your position and your price are not set by a stored score. They are computed against the query, the competitors present in that moment and the context of that search.
Ad Rank thresholds explain a class of problem that Quality Score alone cannot. When an ad does not appear for a search it is clearly eligible for, it has usually failed a threshold, and the lever for that is quality and bid together rather than a number in a column.
It is worth being exact about the relationship, because this is where the two ideas get conflated. Google combines auction-time quality with your bid to determine your Ad Rank, and Ad Rank is what decides whether and where your ad appears. Better ad positions at a lower price come from the quality half of that calculation improving. The reported score is a readout of the same underlying assessment, published for your benefit, and the factors Google uses in the auction are measured per search rather than read off your account.
The core components of Quality Score, and how to improve the weakest one
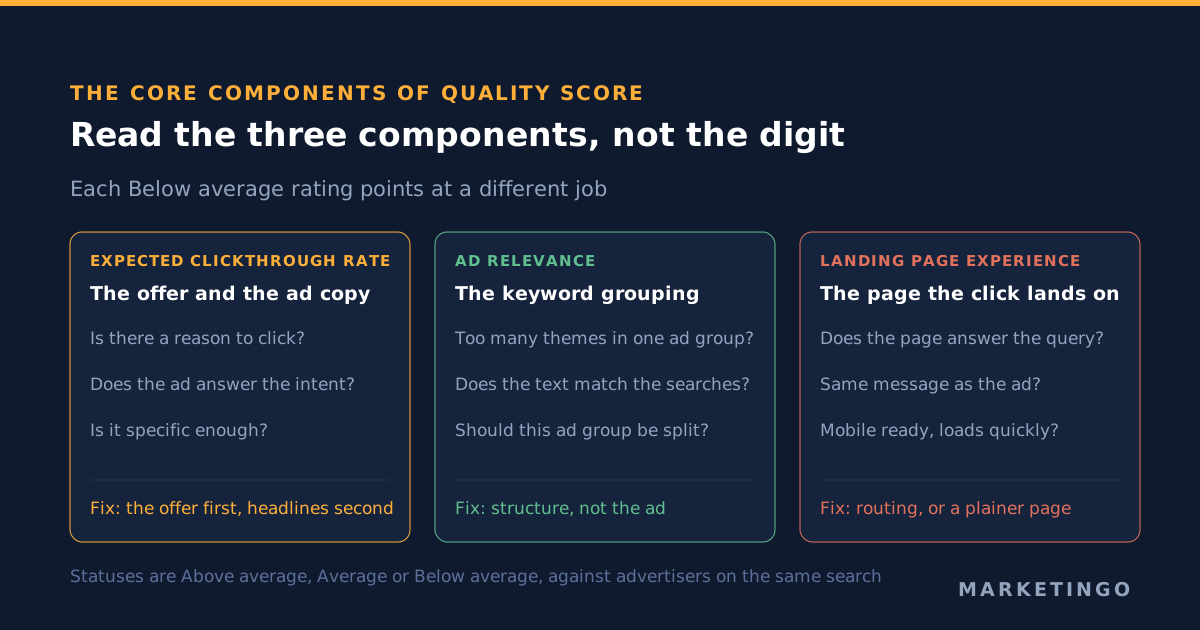
This is the part worth your time, because each component points at a different piece of work. Google's page Five ways to use Quality Score to improve your performance sets out what to do with each, and the recommendations are narrower than most interpretations of them.
Expected clickthrough rate, rated Below average. This component estimates how likely someone is to click on your ad when it shows for that keyword, which makes it the closest thing in the account to a forecast of click-through rate. Google's advice is to edit the ad copy so the offer is more compelling to the audience, to make sure the details in the ad match the intent of the keyword, and to be more specific. In practice this is an offer problem far more often than a copywriting problem. A search carrying commercial intent and an ad that answers it with a general brand message will sit Below average however the headlines are rearranged, because nothing about the rewrite changed the reason to click.
Ad relevance, rated Below average. This component measures how closely your ad matches the intent behind the search, which is really a question about the relevance of your ads to the keywords sitting beside them in the same ad group. Google's advice is to match the language of the ad text more directly to the searches, to split the ad group into several ad groups that are a better match to those searches, and to group keywords into themes. This is a structural symptom. An ad group holding twenty loosely related keywords cannot have text that is relevant to all of them, and the rating is telling you about the grouping rather than about the ad. Our Google Ads account structure piece covers how tightly to group before the structure starts costing more than it returns.
Landing page experience, rated Below average. Google's advice is to give people what they came for, to keep the message consistent from ad to landing page, to make the site work on mobile, and to improve page load speed. Note what is absent: this is not a general site-quality judgement. It is about the fit between a specific search, a specific ad and a specific page, so landing page content that answers the query directly matters more than a redesign. One page serving six different searches will usually read as Below average for most of them, which is why accounts with a single catch-all destination score worse on this component than accounts with several plainer landing pages.
A practical habit. Read the three components as a set rather than the single composite digit. A keyword at 5 with ad relevance Above average and landing page experience Below average is a completely different job from a keyword at 5 with the reverse, and the composite number hides which one you have.
Where to check your Quality Score, and the columns worth adding
You check your Quality Score in the keyword table, and the three component ratings do not appear there by default. Add four columns: Quality Score, Exp. CTR (the expected clickthrough rate component), Ad Relevance and Landing Page Exp. (the landing page experience component). Together they are what Google publishes about the quality of your ads at the keyword level.
Google also publishes historical versions of all four, documented on its Quality Score reporting page: Quality Score (hist.), Exp. CTR. (hist.), Ad Relevance (hist.) and Landing Page Exper. (hist.). The plain columns show the current value. The historical columns show the value as it stood during the reporting period you are looking at, and segmenting the table by day turns them into a time series.
That distinction is the one that makes before-and-after work possible. Comparing this month's performance against the plain Quality Score column compares old performance against today's score. The historical columns let you ask whether the component rating actually moved after the change you made, which is a different and more honest question.
Why the column is full of dashes
A dash in the Quality Score column is not a bad score. Google states that it means "there aren't enough searches that exactly match your keywords to determine a score," and suggests either finding higher-volume keywords with Keyword Planner or broadening match types to gather more data.
This is routine in two situations and worth recognising in both. Long-tail keywords in business-to-business accounts often never accumulate enough exact-search history to earn a score at all, which is normal and not a defect. And a newly launched account will show dashes across the board for a while, so a Quality Score review in week one measures nothing.
There is a trap in Google's second suggestion. Broadening match types to produce a Quality Score is optimizing for the availability of a diagnostic, which usually costs more in wasted impressions than the diagnostic is worth. If a keyword converts acceptably without ever earning a score, the absence of the score is not a problem to solve.
What counts as a good Quality Score
There is no published target, because Google says the metric is not a key performance indicator and should not be optimized or aggregated with the rest of your data. Asking what a good quality score is therefore gets you a judgement rather than a number, and the judgement that holds up is directional.
Treat 7 and above as nothing flagged: no component is behind the field, and the keyword does not need attention on these grounds. Treat 5 and 6 as a prompt to read the components rather than a problem in itself. Treat anything below 5 on a keyword with real spend as a sign of something structural, usually in the grouping or in the destination page.
Two corrections to the instinct that follows. A high Quality Score on a keyword that does not produce customers is not worth defending, and it is the most common reason good accounts waste review time: the score says the search was served well, not that the search was worth buying. And a low Quality Score on a keyword delivering customers at or below your target cost is not an emergency. The component ratings are competitive readings, so a keyword can be behind the field and still be the most profitable line in the account.
Quality Score optimization as an activity in its own right, pursued until the column is full of nines, is the failure mode this metric invites. The score is important only in so far as reading it finds work that changes the economics.
What Quality Score cannot see
Three blind spots account for most of the confusion in modern accounts.
Automated bidding changes the question. With Target cost per acquisition or Target return on ad spend running, the bid half of Ad Rank is set per auction by the model rather than by you. Quality diagnostics still matter, because ad relevance and landing page experience still feed auction-time quality, but the chain from a component rating to a cost per click is now mediated by a bidding model optimizing for something else. Our Google Ads bid strategy piece covers which strategy is reading which signal.
Ad Strength is a different rating entirely. Responsive search ads carry an Ad Strength rating of Poor, Good or Excellent, documented on Google's responsive search ads page, which recommends at least two responsive search ads at Good or Excellent per ad group and notes that pinning assets can lower the rating. Ad Strength assesses the composition of the creative. Quality Score assesses the keyword. They are not two views of the same measurement, and improving one does not necessarily move the other.
Measurement quality is invisible to it. A keyword can sit at 9 out of 10 on all three components and still be the most expensive mistake in the account, if the conversion it is credited with is a form fill that never becomes a customer. Quality Score says nothing about whether what you count is worth counting. That is the job of the tracking layer, which our Google Ads conversion tracking piece covers, and of the exclusion discipline in negative keywords.
Microsoft Advertising reports its own keyword-level quality score on a similar 1-to-10 scale with components of the same names, so an account running Google Ads and Microsoft Ads side by side gets two diagnostics rather than one. The readings diverge regularly, because each is comparative against a different set of advertisers on a different search network, and a divergence is usually information about the two auctions rather than an error in either number.
The routine: a diagnostic pass that produces changes
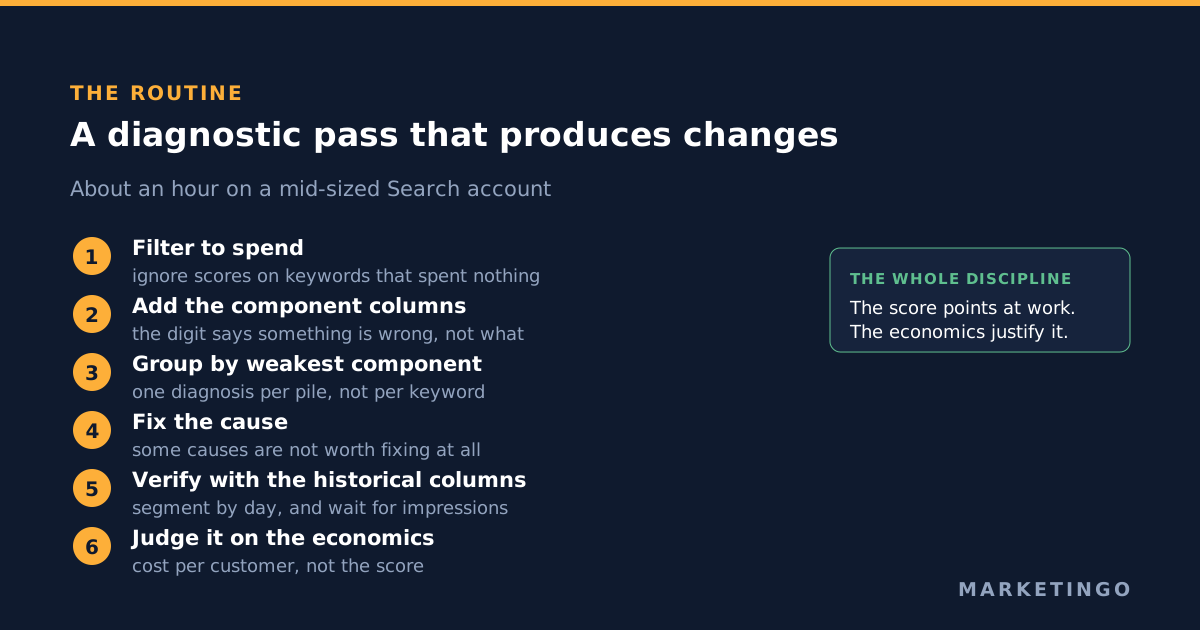
This is the pass we run inside a wider account review, and it takes about an hour on a mid-sized Search account.
-
Filter to keywords that matter. Sort the keyword table by cost over the last 90 days and work only on keywords that spent enough to be worth an hour. A 3 out of 10 on a keyword that spent $14 last quarter is not a finding.
-
Add the three component columns and ignore the composite digit. The composite tells you that something is wrong. The components tell you what, and only one of the three answers is "write a better ad." The instruction that follows from this is always the same: improve the weakest component and leave the other two alone.
-
Group the keywords by weakest component, not by score. Every keyword whose weakest component is ad relevance belongs in one pile, because they will probably be fixed by the same restructuring. Every keyword weak on landing page experience belongs in another, because those are usually fixed by routing clicks to a page that matches the search. Working keyword by keyword down a sorted score column repeats the same diagnosis twenty times.
-
Fix the cause, and accept that some causes are not worth fixing. A keyword with persistently Below average expected clickthrough rate on a search whose intent you cannot serve is a candidate for removal or for a negative keyword, not for a fourth round of headline testing.
-
Verify with the historical columns, segmented by day. This is the step that is nearly always skipped. Check whether the component rating moved after the change, not whether the composite number moved, and give it enough impressions to be meaningful before concluding anything.
-
Judge the outcome in the metric the business uses. Cost per acquired customer, cost per qualified lead, or return on ad spend. If a component rating improved and none of those moved, the change was cosmetic, and that is a useful finding rather than a failure.
Step 6 is the whole discipline in one line. Quality Score points at work. The work is justified by what it does to the economics, never by what it does to the score.
When a low Quality Score is the wrong thing to fix
Three cases, all common.
The keyword is fine and the search is not. A term can be perfectly relevant to your ad and your page and still be bought by people who will never purchase. The component ratings will look acceptable and the keyword will still be wasting money. That is a search terms problem, visible in the search terms report rather than in the quality columns.
The account has a conversion-counting problem. If the tracking layer counts the wrong events, every downstream diagnostic including this one is being read against a distorted picture of what worked. Fix the measurement first.
The score is a symptom of a structural decision you made deliberately. A single consolidated campaign built for a bidding model that needs volume will often show weaker ad relevance than a tightly themed one, because broader ad groups are the cost of the structure. If that trade was made on purpose and the economics are good, the lower rating is a price, not a defect.
What this looks like when it is run properly
Quality Score work is a reading exercise that produces a list of structural changes. The discipline is to read the three components rather than the composite, to group the findings by cause, to verify with the historical columns, and to measure the result in the metric that pays the bills.
The clearest example of the mechanism we have is in our business-to-business software case study, where restructuring query control and rebuilding the match between search, ad and landing page took clickthrough rate from 0.34% to 2.28%, a 6.7x move, while spend and impressions both came down. Expected clickthrough rate is the component that tracks that kind of change most directly, and the point is that the component rating followed the restructuring rather than the restructuring following the rating.
If you want to know which of your own keywords are carrying a Below average component while spending real money, that is one of the first things a free paid media audit looks at. We run Google Ads management for business-to-business lead generation and for retail, and for high-ticket business-to-business services in particular the landing page experience component is usually where the account is leaking, because one page is being asked to answer six different searches. To work out what a cost per click improvement is actually worth to you before chasing it, the lead generation return on investment calculator will tell you faster than a Quality Score column will. For the order to inspect the rest of the account in, our Google Ads audit checklist covers the full surface.