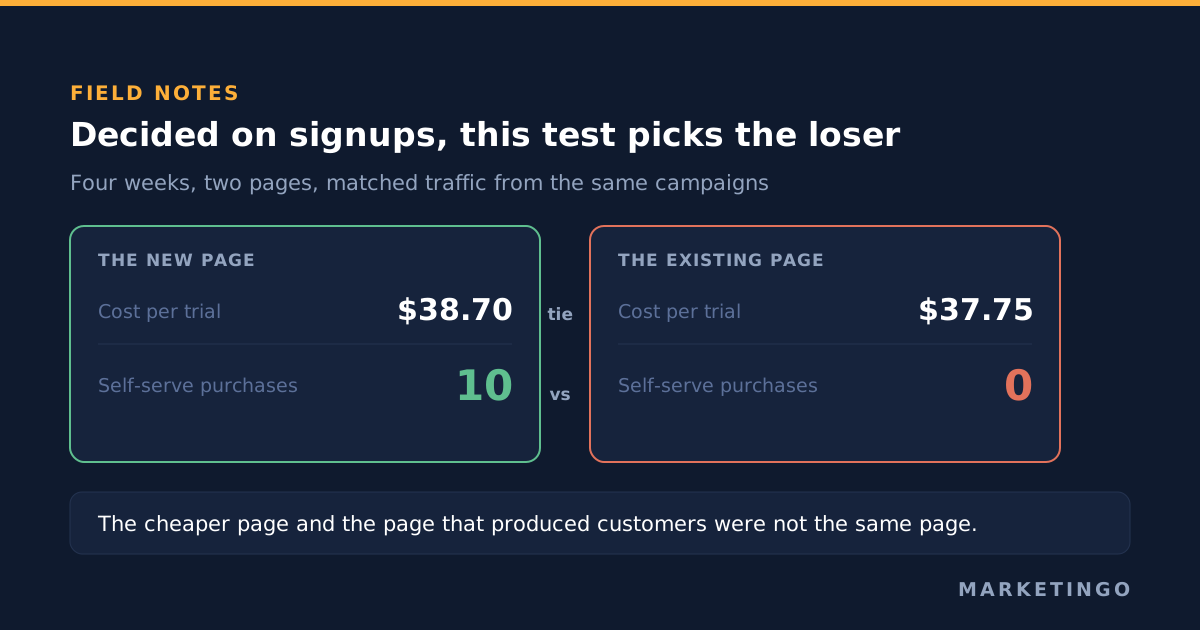
A compliance and document security software company we manage paid search for had been sending every visitor, trial seeker and enterprise buyer alike, to the same homepage. We built a dedicated page for the self-serve trial and ran it against the existing one for four weeks, both versions taking traffic from the same campaigns and the same keywords.
On cost per trial the test was a tie. The new page came in at $38.70 and the existing page at $37.75, which is inside the noise on that sample and, read literally, a narrow win for the page we were trying to replace. On purchases the split was 10 to 0. Every self-serve purchase recorded in the window came from the new page.
The metric that decides the test is almost never the metric that matters
The first conversion in a funnel is the one everyone measures. For a software company it is the free trial, for a services business the form fill, for a subscription product the email signup. It is measured because it happens often enough to produce a number within a sensible window, and because it is usually the only event wired into the ad platform as a conversion action.
That makes it a surrogate. A surrogate stands in for the outcome you actually care about and it only works while the two move together. The moment a change to the page alters who converts rather than how many, the surrogate and the outcome come apart, and a test read on the surrogate returns the wrong winner with full statistical confidence. One version can perform better on signups and worse on revenue at the same time, and nothing in the signup report says so.
That is what happened here. The new page was more specific about what the product does and what the trial includes, which filtered out a slice of visitors who would have signed up and never bought. Fewer, better-qualified trials at a marginally higher cost each. On the signup number it looked like a draw. On revenue it was not close.
The arithmetic that pushes everyone to the cheap metric
The reason almost nobody runs one of these tests all the way to the purchase is not laziness. It is sample size, and the arithmetic is unforgiving.
To detect a 20% relative improvement at the usual thresholds, roughly 80% power and 95% confidence, the traffic needed per version is about 16 multiplied by one minus the conversion rate, divided by 0.04 multiplied by the conversion rate. The shape that matters is the conversion rate sitting in the denominator: the rarer the event, the more traffic the test needs, and it climbs fast.
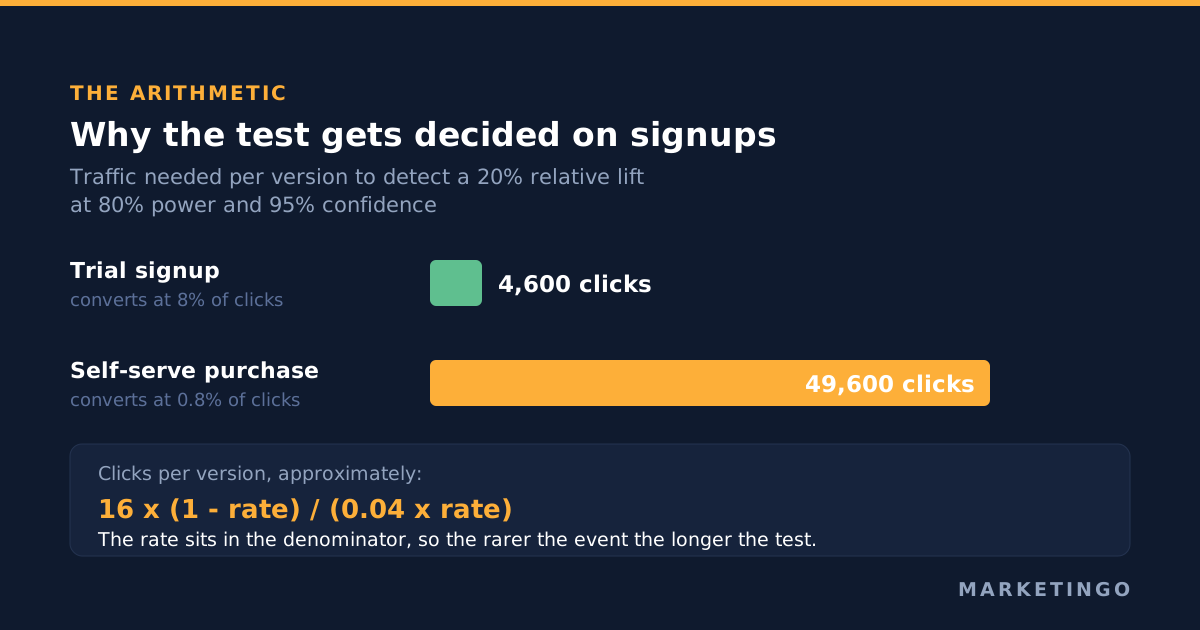
Put a plausible pair of rates through it. At an 8% trial rate the test needs roughly 4,600 clicks per version. At a 0.8% purchase rate, the kind of number a self-serve software funnel actually produces, the same test needs roughly 49,600 clicks per version. Eleven times the traffic, which on most budgets is the difference between a four-week test and a two-year one.
So the constraint is real. The conclusion people draw from it is the error. Nothing about the sample size problem makes the signup number a valid substitute for the purchase number. It only means you cannot have a significance test on the purchase, which is a different and much smaller loss than it sounds.
What we did about it instead of waiting for significance
A 10 to 0 split is not statistically significant on ten events. It is also not ambiguous. Ten purchases against zero, on both pages taking matched traffic from the same campaigns over the same four weeks, is a margin wide enough to act on even though no calculator will stamp it.
Refusing to call the test early mattered more than it sounds. At the end of the first clean week the existing page was ahead on cost per trial at $33.28. A week later, on $4,137 of spend across both platforms, trials ran to 89 at $46.50 and purchases moved from 2 to 9, with every self-serve purchase sitting on the new page. One week inside the window produced 83 trials at $42.96 on $3,566 of spend and 8 single-document purchases. A test stopped anywhere in the first fortnight would have read as a tie or a narrow loss.
The order we run a landing page A/B test in now
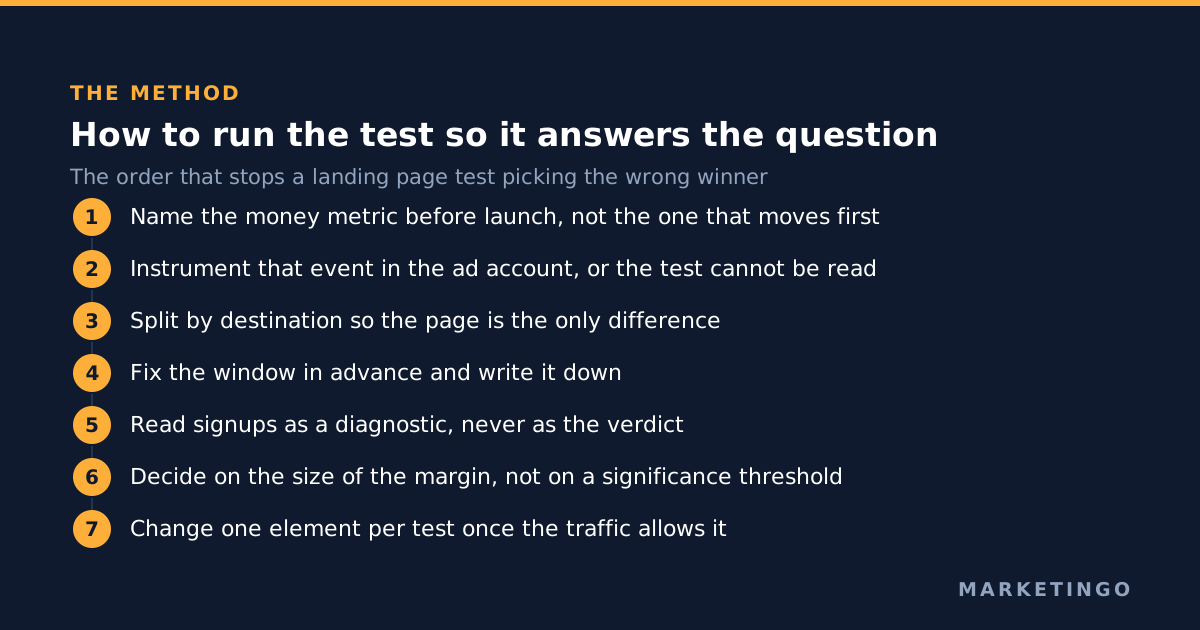
- Name the decision metric before anything goes live, and make it the furthest-down event you can measure at all. Not the one that will reach significance. The one that pays for the campaign. Write it down, because the temptation to switch to the metric that is moving arrives in week two.
- Instrument that event first. If purchases, qualified leads or closed revenue do not exist as conversion actions in the ad account, the test cannot be read whatever the page does. This is usually a week of conversion tracking work before any design work, and it is not optional.
- Split by destination, not by audience. Both versions should draw from the same campaigns, keywords and audiences, so the only difference between the arms is the landing page itself. Google documents a Test function on the tracking template and final URL settings, available at any level of the account. Worth knowing before you rely on it: Google's own instructions for testing a landing page say nothing at all about which conversion to measure or how long to run, and since Google Optimize was withdrawn on 30 September 2023 there is no free first-party tool filling that gap either.
- Fix the window in advance and record it. Ours was four weeks. A window chosen before the data arrives is the only defence against reading noise as a result.
- Read the cheap metric as a diagnostic, not as the verdict. Signup volume, bounce rate and time on page, the figures an analytics package reports by default, tell you whether the landing page is working as a page. They do not tell you which version produced customers. Both readings are useful as long as you never let the first one close the question.
- Decide on the margin, not on the count. Ten to zero is actionable. Six to four is not, and the honest answer there is that the test did not resolve and the next change should be larger.
- Change one thing per test, then test the next thing. A multivariate test that varies the headline, the call to action and the form at once needs several times the traffic of a straight two-version comparison, and on a funnel this thin you do not have it to spend.
What the signup number is still good for
Dropping the surrogate entirely is the opposite mistake. The two readings answer different questions and you want both.
Cost per trial told us the new page was not broken. Had it come in at double the existing page we would have stopped the test and fixed the page rather than running it out, because a page that halves the top of the funnel is rarely rescued by better downstream quality. The signup rate is the sanity check that keeps a four-week commitment from being a four-week waste. It is the verdict only when the signup is the sale.
That is also why the two numbers belong in the same report. A version that holds its lead conversion rate and improves what happens after it is unambiguously better. A version that trades half its volume for a slightly better downstream mix needs the arithmetic run properly before anyone calls it a win, which is what a cost per lead ceiling derived from real contract values is for.
What we changed, and what that cost us in learning
Worth being straight about a limitation in our own test. We did not vary one element at a time. We replaced the whole page, so the result tells us the new page was better and nothing at all about why.
That is the trade every operator makes here. Testing one variable at a time, the headline alone, then the call to action, then the form length, tells you which element did the work and lets you compound the wins. It also multiplies the number of tests by the number of elements, and each one needs its own window. On a funnel where the money event arrives at well under one percent of clicks, a disciplined one-variable-at-a-time programme would take years to run.
So we test whole-page variations first to find a direction that works, then isolate elements inside the winner once there is enough traffic to do it properly. If you have the volume to optimize element by element from the start, do that instead. Most accounts we see do not, and pretending otherwise produces a long series of tests that never resolve.
When this does not apply
Single-step funnels. If the conversion is the purchase, as in most direct to consumer ecommerce, there is no surrogate and no problem. Test on revenue per visitor and ignore everything above.
Sales cycles longer than any sensible test window. When the money event lands six months after the click, no landing page test will reach it. Use the furthest-down event that does land inside the window, usually a qualified opportunity rather than a raw lead, and accept that it is still a surrogate.
Accounts with no downstream volume at all. A funnel producing two purchases a month cannot tell you anything about a landing page, by any method. Fix targeting and offer first, and come back to page testing when there is something to measure.
Mechanical faults. A broken form, a page that will not load on a phone, a missing price. These do not need a test. They need fixing, and running a test on them wastes the window.
Where to start if your tests keep ending in a tie
A test that keeps returning a draw is usually not telling you the two pages are equivalent. It is telling you the measurement stops too early in the funnel to see the difference. The fix is upstream of any design decision: get the event that represents money into the ad platform, then test against it. Conversion rate optimization that stops at the signup is optimising a proxy, however carefully it is run.
That is the first thing we look at in a free advertising account audit, because it decides whether anything else in the account can be read. The funnel split that preceded this test is written up in our compliance and document security software case study, where separating the enterprise and self-serve paths grew demo bookings 128%. The same habit runs through how we audit a platform representative's recommendations against account data rather than taking them on trust.
For what a signup is allowed to cost once you know what it converts into, our lead generation return on investment calculator works backwards from closed revenue. The Google Ads management and business to business software pages set out how we run this for software companies.