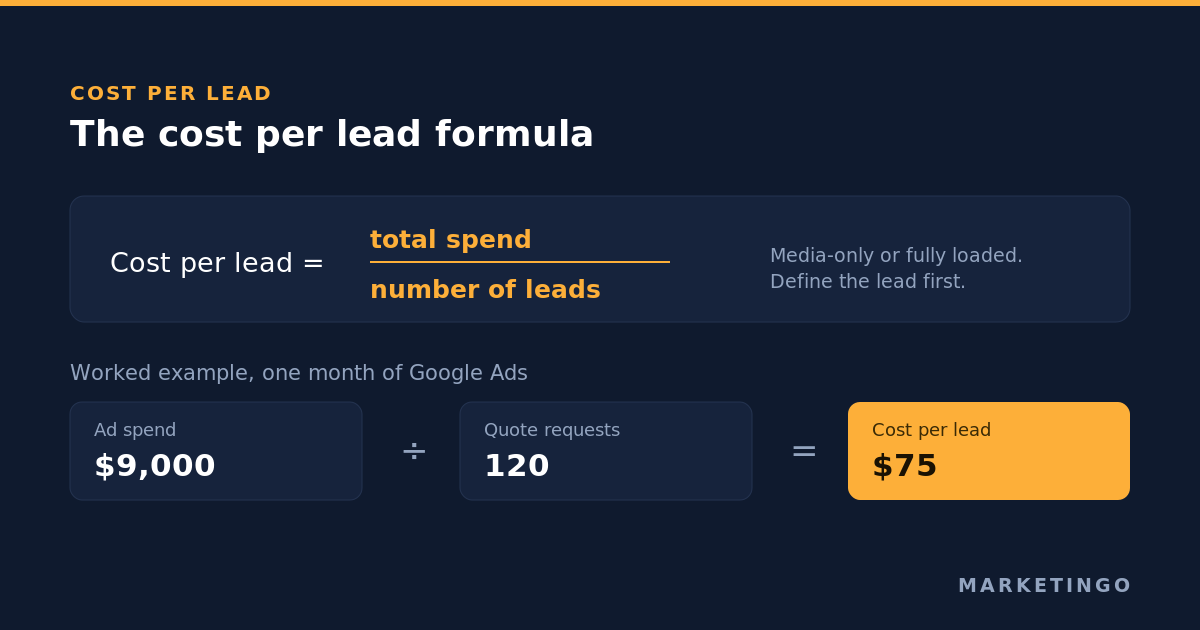
Cost per lead is the total amount spent on a campaign, channel or period divided by the number of leads it produced. Spend $9,000 on Google Ads in a month and receive 120 quote requests, and your cost per lead is $75. That is the whole formula, and it hides three decisions that change the answer by a multiple: what counts as spend, what counts as a lead, and over what period you measure.
The question people actually type into Google is not "how do I calculate it" but "what is a good cost per lead". The honest answer is that no industry average can tell you. A good cost per lead is derived from your own economics: multiply the gross profit one new customer leaves you by the share of leads that become customers, and you have the most you can pay for a lead before the campaign loses money. A good CPL sits comfortably below that ceiling. Everything else in this article, including the 2026 benchmark tables, exists to help you check whether your funnel is in a normal range, not to tell you what to aim for.
The cost per lead formula, and the three decisions inside it
Cost per lead (CPL) = total spend ÷ number of leads generated.
The formula is trivial. The definitions are not, and the two most-cited benchmark reports in this category disagree by up to 6x for the same industry mostly because they define the inputs differently. Settle these three before you compute anything:
What counts as spend. Media-only CPL divides ad spend alone by leads and is the number the ad platforms show you. Fully loaded CPL adds the agency or management fee, landing page and tooling costs, and, if you want the true figure, the salaries of the people running the campaign. A $75 media-only CPL on $9,000 of spend becomes $100 once a $3,000 monthly management fee is included. Use media-only CPL to compare campaigns against each other, and fully loaded CPL to decide whether the channel is worth running at all.
What counts as a lead. A lead can be anything from a newsletter signup to a verified quote request from a company in your target segment. Google Ads reports "conversions", and a conversion is whatever action you told it to count. If the account counts every form interaction, phone click and chat open as a lead, the reported cost per lead will be low and meaningless. The account examples later in this article show what happens when the definition is tightened: the reported CPL rises and the business does better.
Over what period. CPL over a week is noisy, especially in B2B where 20 leads a month is a healthy number. Measure it monthly by channel and campaign, and put the lead-to-customer conversion rate in the column next to it, because CPL without that rate is half a metric.
A worked example. A consultancy spends $6,000 in a month on Google Ads and generates 150 leads. Media-only CPL is $40. Add a $2,500 agency fee and the fully loaded CPL is $56.67. If 12 of those 150 leads become clients, the lead-to-customer rate is 8% and the customer acquisition cost is $708 fully loaded. That last number is the one the owner should manage to, and the customer acquisition cost article covers it in depth.
What cost per lead measures, and where the formula applies
CPL measures the cost of acquiring a single new lead: a potential customer who has raised a hand, usually by choosing to fill out a form, book a call or start a trial. It is a marketing metric rather than a sales one, which is both its strength and its limit. The strength is speed: a marketing team can read cost per lead the morning after a change to an ad campaign, long before a single deal closes. The limit is that it says nothing about whether the lead was worth having.
The formula applies to any marketing channel that produces an identifiable lead, and it is the common currency for comparing them. Paid ads on Google, Microsoft, Meta and LinkedIn report it natively, because pay-per-click platforms bill by the click and count the conversions that follow. Email marketing, content marketing, events and referral programs produce leads too, and the same arithmetic works once you attribute the marketing spend and the leads to the channel, though the timing is looser and the attribution softer. Divide total marketing spend across every channel by every lead the marketing budget produced and you have blended cost per lead, the figure a finance team recognizes.
Two habits make the metric useful over time. Track CPL monthly, by channel and by campaign, next to the lead-to-customer rate, so that a higher CPL with a higher close rate reads as the improvement it is. And treat the platform's "cost per action" or "cost per conversion" as cost per lead only when the counted action is the lead you would pay a salesperson to follow up on. Lead nurturing, sales follow-up and the return on investment of the whole program sit downstream of that definition, and every one of them is distorted when the definition is loose.
What is a good cost per lead? Start from your margin, not from a benchmark
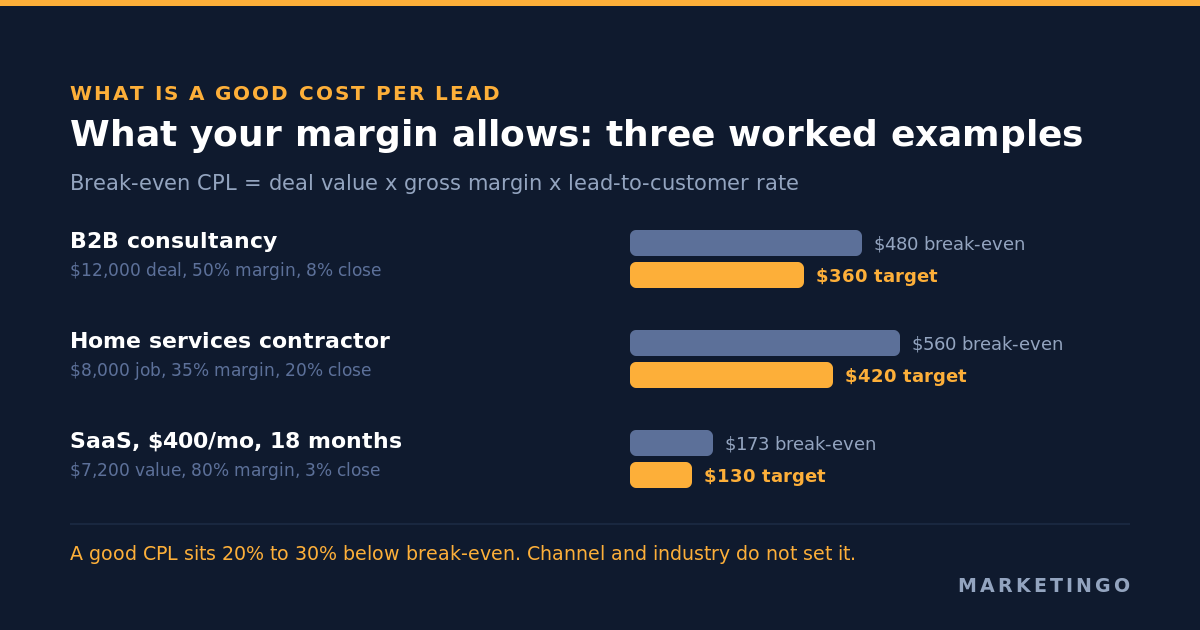
The number that decides whether a cost per lead is good is the break-even cost per lead: the most you can pay for one lead and still make zero profit on the customers those leads become.
Break-even CPL = average deal value × gross margin × lead-to-customer rate.
Three worked examples make the range obvious:
| Business | Deal value | Gross margin | Gross profit per customer | Close rate | Break-even CPL | Target CPL (25% below) |
|---|---|---|---|---|---|---|
| B2B consultancy | $12,000 | 50% | $6,000 | 8% | $480 | $360 |
| Home services contractor | $8,000 | 35% | $2,800 | 20% | $560 | $420 |
| SaaS, $400/month, 18-month retention | $7,200 | 80% | $5,760 | 3% (trial to paid) | $173 | $130 |
Read the table against the benchmark figures later in this article and the gap is the point. The consultancy could pay $480 a lead, more than three times the highest industry median in Google's search benchmarks, and still break even. The SaaS company, with the highest margin of the three, can afford the lowest CPL because its trials convert at 3%. Margin and close rate decide the ceiling; the channel and the industry do not.
Two rules follow. First, aim 20% to 30% below the break-even figure, so every customer leaves real profit behind and a bad month does not tip the channel into a loss. Second, recompute the ceiling whenever the close rate moves, because a campaign that doubles lead volume while halving the close rate has left the break-even CPL exactly where it was while the real cost per customer doubled. The lead generation ROI calculator computes the break-even CPL and the break-even customer acquisition cost from deal value, margin and close rate, for one-time sales and for monthly retainers, and it is the fastest way to get your own number before you look at anyone else's.
If you sell online rather than through a sales conversation, cost per lead is the wrong metric altogether, and the ecommerce ROAS calculator plus the break-even ROAS article are the equivalents for your side of the business.
Average cost per lead by industry in 2026: two datasets
Two reports get cited in almost every article on this subject. Both are worth reading, and they are not measuring the same thing, which the next section explains.
Google and Microsoft search ads, WordStream 2026
WordStream's 2026 Google Ads benchmarks cover 13,474 US search advertising campaigns running between April 2025 and March 2026, across Google Ads and Microsoft Ads. The figures are medians, and they report the overall average cost per lead at $66.69, the first year-over-year decrease the report has recorded since before 2020. Overall click-through rate was 6.64%, cost per click $5.42 and conversion rate 8.18% in the same dataset.
| Industry | Average CPL, search ads (WordStream, Apr 2025 to Mar 2026) |
|---|---|
| Attorneys and legal services | $131.63 |
| Furniture | $106.70 |
| Real estate | $102.51 |
| Apparel, fashion and jewelry | $97.51 |
| Business services | $93.69 |
| Home and home improvement | $90.92 |
| Education and instruction | $77.48 |
| Industrial and commercial | $75.19 |
| Finance and insurance | $74.44 |
| Dentists and dental services | $72.97 |
| Health and fitness | $67.36 |
| Physicians and surgeons | $40.04 |
| Beauty and personal care | $39.25 |
| Animals and pets | $31.50 |
| Restaurants and food | $30.57 |
| Automotive, repair, service and parts | $29.96 |
| Arts and entertainment | $26.84 |
The same report shows how far costs have moved over a decade: its first edition in 2016 recorded a $59.18 average cost per lead and a $2.32 cost per click, against $66.69 and $5.42 in 2026. Cost per click has more than doubled while cost per lead rose about 13%, which only works because conversion rates roughly tripled over the same period, from 2.70% to 8.18%. Anyone still running an account tuned for 2016 click prices is paying for the difference.
B2B and high-ticket, First Page Sage 2026
First Page Sage's average cost per lead by industry report draws on its own client data collected between January 2022 and June 2025, splits paid from organic, and defines a lead as a direct connection by email, phone or in person to a prospective customer interested in buying.
| Industry | Average paid CPL | Average organic CPL | Blended CPL |
|---|---|---|---|
| Higher education | $1,261 | $705 | $982 |
| Legal services | $784 | $516 | $649 |
| Oil and gas | $772 | $502 | $637 |
| Financial services | $761 | $555 | $653 |
| Manufacturing | $691 | $415 | $553 |
| Software development | $680 | $510 | $591 |
| IT and managed services | $617 | $385 | $503 |
| Real estate | $480 | $416 | $448 |
| Cybersecurity | $411 | $404 | $406 |
| Healthcare | $401 | $320 | $361 |
| B2B SaaS | $310 | $164 | $237 |
| Construction | $280 | $174 | $227 |
| HVAC | $115 | $69 | $92 |
| Ecommerce | $98 | $83 | $91 |
Why the two benchmarks disagree by 6x, and what that tells you about "average CPL"
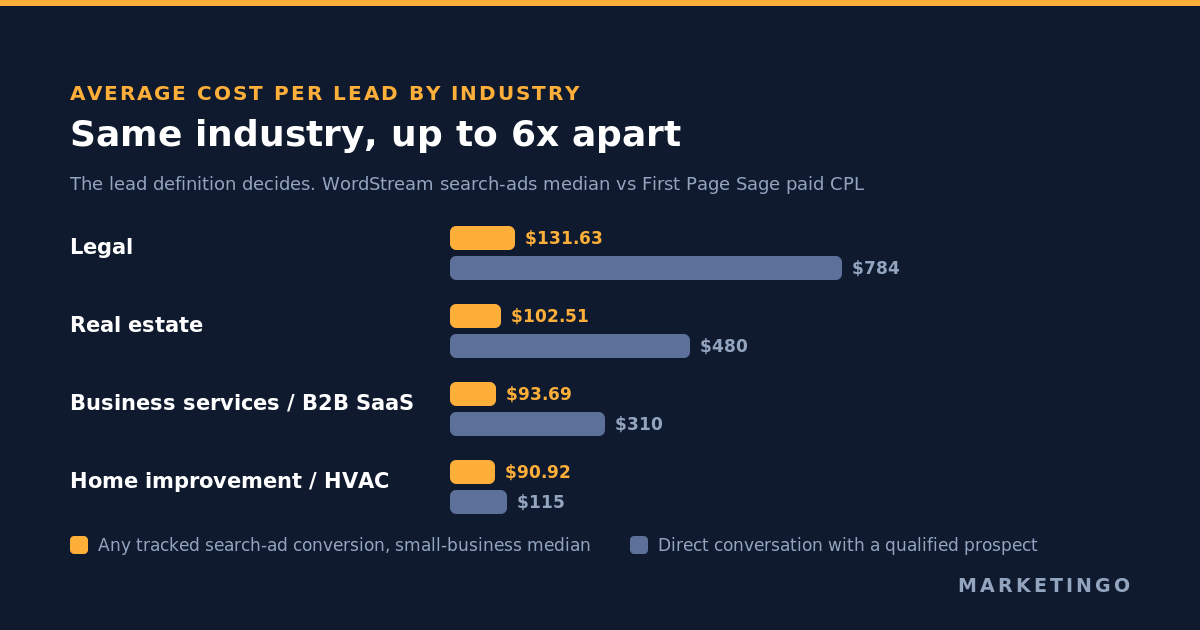
Put the two tables next to each other for the industries they share and the gap is not a rounding difference. Legal is $131.63 in one dataset and $784 for paid leads in the other, a 6x gap. Real estate is $102.51 against $480. Business services at $93.69 sits against B2B SaaS at $310. Home improvement at $90.92 against HVAC at $115 is the one place they nearly agree.
Both reports are accurate about their own data. The claim "the average cost per lead in legal is $X", repeated across hundreds of articles that cite one or the other, does not hold up, for three reasons that are visible in the methodology notes.
The lead definition is different. WordStream counts a Google Ads or Microsoft Ads conversion, which in a small-business account is typically a form submission, a call from the ad or a chat, whatever the advertiser chose to track. First Page Sage counts a direct connection with a prospect interested in purchasing, which is closer to a qualified lead in a B2B sales process. One qualified lead usually costs several raw form fills, so the second definition should produce a higher number before any other factor is considered.
The sample is different. The search benchmarks are medians across 13,474 campaigns skewed toward small and local advertisers running on a marketing platform. The First Page Sage figures come from that agency's own client base, which leans toward mid-market and enterprise B2B with long sales cycles. A personal injury firm buying calls and an enterprise legal-tech vendor buying discovery meetings are both "legal", and neither number describes the other.
The cost base is different. One is media cost per platform conversion. The other is the gross marketing cost per lead across a channel, closer to the fully loaded figure. Note also that First Page Sage sells organic search services, and its report is the source of the widely repeated claim that organic leads cost 40% to 60% less than paid ones. That may well be true of its clients; it is also the finding you would expect a search-optimization agency's own data to produce, and it says nothing about how long each channel took to produce those leads.
The practical conclusion: use the search benchmarks to check whether your click-through rate, cost per click and conversion rate are in a normal range for your category, because those are platform mechanics and a wide deviation usually points to a fixable problem. Do not use either table to decide whether your cost per lead is good. Only your break-even CPL can do that.
Cost per lead by channel: search, Microsoft, Meta and LinkedIn
Channel changes the cost per lead more than industry does, because each channel intercepts a different moment of intent.
Google Search captures people who are already looking, so it produces the lowest cost per qualified lead in most B2B and local-service categories, at the highest cost per click. A regulatory-compliance consultancy that came to MarketinGO with a $112 cost per lead on Google Ads ended six months later at $40.25, a 64% reduction, with 557 additional leads and $4,000 less spend, almost entirely by restructuring search campaigns around the terms that produced clients rather than the terms that produced clicks. The full method is in the Google Ads management service description, and the account-level checklist in the Google Ads audit article.
Microsoft Ads reaches the same intent on Bing, DuckDuckGo and the Windows search surfaces at a lower cost per click, with less competition, and it is the most underused lever in lead generation accounts. A home improvement contractor running Google and Microsoft Ads together cut cost per lead from $47.01 to $32.99, a 30% reduction, while expanding from 14 states to 17. Microsoft rarely matches Google's volume, but as a second channel it consistently lowers the blended CPL, which is why MarketinGO's Microsoft Ads management sits alongside Google in nearly every lead generation engagement.
Meta does not capture intent; it creates it. Cost per lead on Meta is often lower than search on paper because lead forms inside the platform remove the landing page step, and the lead quality is often lower for the same reason. Meta works for lead generation when the offer is concrete and the lead definition is tight, and the sports-apparel example below shows the difference between counting Meta's broad lead events and counting contact-form submissions.
LinkedIn has the highest cost per click of the four and, for B2B companies selling to a specific job title at a specific company size, the highest lead quality. An AI compliance SaaS grew demo requests 66% in 60 days, from 6 to 10 a month, on a lean Google plus LinkedIn launch, because LinkedIn's targeting reached the buyer and search caught the buyer's intent. LinkedIn's cost per lead is rarely the lowest in the account and rarely the metric to judge it by; cost per opportunity is. LinkedIn Ads works best run alongside search rather than in isolation.
The through-line for high-ticket B2B and home improvement alike: the channel with the lowest cost per lead is not the one to scale, the channel with the lowest cost per customer is, and those are frequently different.
Cost per lead, cost per acquisition and customer acquisition cost
The three metrics are confused with each other constantly, and the confusion costs money because ad platforms optimize toward whichever one you feed them.
Cost per lead is spend divided by leads. It is a marketing metric, measurable the same day, and the platforms can bid to it directly.
Cost per acquisition (CPA) is spend divided by whatever conversion action the platform counts. In Google Ads, "cost per conversion" and CPA are the same number, and if the counted action is a lead form then CPA equals CPL. The term is fluid; the definition inside your account is what matters.
Customer acquisition cost (CAC) is total sales and marketing cost divided by new customers won. It includes the sales team's time and the losses on leads that never closed. CPL feeds it: CAC equals CPL divided by the lead-to-customer rate, plus the sales cost per customer. A $75 lead at an 8% close rate is a $937 customer before sales costs. The LTV to CAC ratio article explains how to judge that number against customer lifetime value, and the marketing efficiency ratio piece covers the blended view of spend against revenue.
Where a sales process has stages, add cost per marketing-qualified lead and cost per sales-qualified lead between CPL and CAC. The stage at which cost per lead should be optimized is the earliest one that predicts revenue. For most B2B accounts that is the sales-qualified lead, not the form fill, which is why feeding qualified-lead conversions back into Google Ads and Meta through offline conversion imports has become the single highest-value tracking change in lead generation.
When a rising cost per lead is the best news in the account
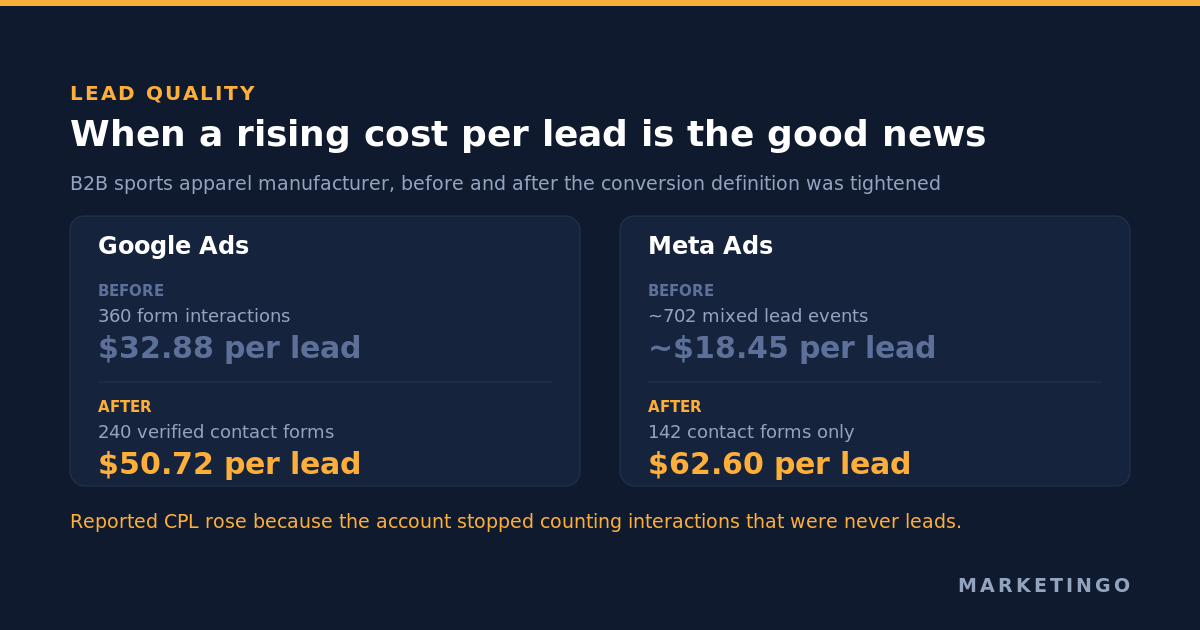
A B2B sports apparel manufacturer came to MarketinGO with a reported cost per lead of $32.88 on Google Ads and about $18.45 on Meta. Seven months later the reported figures were $50.72 and $62.60. Cost per lead went up 54% on Google and more than tripled on Meta, and the account was in far better shape.
The old Google number was built on a generic form-interaction event. On the core campaign that event reported 152 conversions against 136.5 actual quote-request submissions, and the gap was people who touched a form and never submitted it. The old Meta number mixed broad lead events with contact-form events. Once the tracking counted only verified contact-form submissions, the lead count fell from 360 to 240 on Google and from about 702 to 142 on Meta, spend on Meta fell from $12,953 to $8,890, and the cost per lead rose to reflect what a lead actually was. One product angle that had spent $933 for zero verified leads under the old tracking produced 13 from $1,013 once it was rebuilt against the correct conversion.
The lesson generalizes. Before you compare a cost per lead to any benchmark, or to last quarter, check what the conversion action counts. A CPL that fell because the definition loosened is not an improvement, and a CPL that rose because the definition tightened is not a decline.
A related trap appears in accounts that optimize to "all conversions". A document-security SaaS had both platforms running on a single blended conversion goal, so the bidding algorithm chased the cheapest action, which was trial signups, instead of the plan purchases and enterprise demo bookings the business needed. Splitting search into an enterprise demo funnel and a self-serve trial funnel, each with its own conversion goal, grew demo bookings from 14 to 32 a month and cut the blended cost per conversion 11.2% on a near-flat budget. The cost per lead did not fall because the ads got cheaper. It fell because the account stopped paying for the wrong lead.
How to lower cost per lead without lowering lead quality
In rough order of how often each one produces the largest reduction in accounts MarketinGO audits:
1. Fix what the platform counts. Define a lead as the action that predicts revenue, remove the events that do not, and import qualified-lead or closed-won outcomes back into Google Ads and Meta so the bidding systems learn from customers rather than clicks. This is the lever that changes every downstream number, and it is the one most accounts skip.
2. Cut the search terms that produce leads nobody wants. In B2B accounts, a large share of spend typically lands on search terms that produce form fills from job seekers, students and existing customers. A monthly search-term review with disciplined negative keyword lists lowers the cost per qualified lead even when the reported CPL barely moves.
3. Rebuild the landing page around one action. Conversion rate is the denominator of cost per lead. Halve the friction on the page, remove the navigation, match the headline to the ad, and ask for the minimum information the sales team needs to qualify, and the same spend produces more leads. Test the form length: a longer form often raises CPL and lowers cost per customer at the same time, because it filters.
4. Bid to the right target. Target cost per acquisition bidding works when the conversion it optimizes is a qualified lead and the campaign gets enough of them for the system to learn. Set the target from the break-even CPL rather than from a benchmark, and give each funnel its own goal rather than blending everything into one.
5. Add the second search engine. Microsoft Ads, imported from the Google account and tuned separately, reliably lowers the blended cost per lead in the categories where Microsoft has audience, which includes most professional services, B2B software and home services.
6. Run remarketing as its own layer. A small remarketing budget behind the prospecting campaigns lifts the conversion rate of traffic already paid for. In the sports-apparel account above, a remarketing layer that did not exist before was added on both platforms while total spend fell.
7. Improve the offer before the ad. A free audit, a fixed-price starter package or a specification checklist converts the same click at a higher rate than "contact us". This is the lever that works when the account is already technically clean.
Track the result monthly, by channel and by campaign, with the lead-to-customer rate beside each cost per lead figure. A channel whose CPL rose 20% while its close rate doubled has become cheaper, and the report should say so.
Find out what your cost per lead should be
The free ad audit starts with the two numbers this article is built on: what the account currently counts as a lead, and what the business can afford to pay for one. From there the audit covers the search terms, conversion tracking, bid targets and channel mix in the account, and what each would do to the cost per qualified lead. It applies across Google Ads, Microsoft Ads, Meta and LinkedIn, and it is written for the B2B, SaaS and home services companies whose whole growth model runs on cost per lead. The metrics hub has the calculators and the sibling articles on customer acquisition cost, LTV to CAC and marketing efficiency ratio.