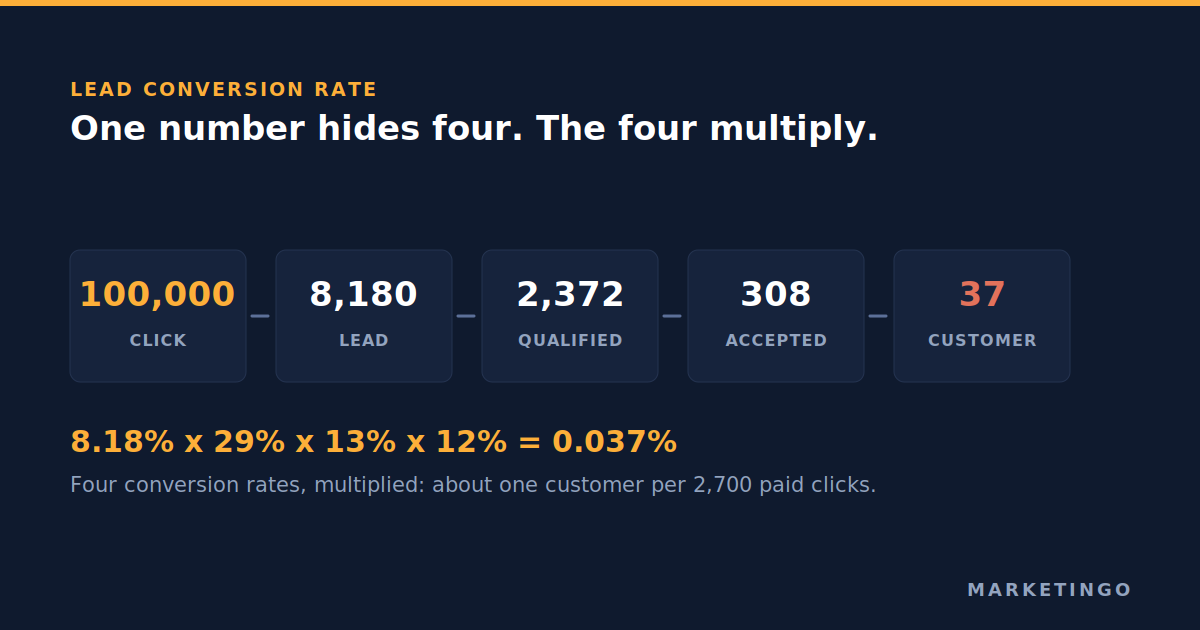
Lead conversion rate is the percentage of leads that become customers. Divide the number of leads that converted by the total number of leads in the same period and multiply by 100. A hundred leads and eight new customers is an 8% lead conversion rate, and that single number is what most dashboards report.
The number is also close to useless on its own, because a paid media budget does not cross one conversion step on its way to revenue. It crosses four: a click becomes a lead, a lead becomes a qualified lead, a qualified lead becomes an accepted sales opportunity, and an opportunity becomes a paying customer. Each of those four has its own rate, its own published benchmark, and its own definition of what counts. The rates multiply. A team reporting one healthy lead conversion rate can be losing most of its budget at a stage it never measures.
This article gives you the formula for each of the four, the 2026 benchmark data with the sample size and date range attached to every figure, one very famous benchmark that falls apart when you go looking for its source, and the arithmetic that turns four percentages into a cost per customer you can act on.
The lead conversion rate formula
Lead conversion rate = (converted leads / total leads) x 100
Two details decide whether the output means anything.
The first is the period. A lead that arrives on the last day of the month cannot convert inside that month, so a rate calculated on same-period leads and same-period closes understates performance whenever volume is growing and overstates it whenever volume is falling. For anything with a sales cycle longer than a couple of weeks, calculate on a cohort: take the leads that arrived in March and ask how many of them had closed by the end of your typical sales cycle, then report that figure against March.
The second is the word "lead". A form fill, a phone call, a chat session, a demo request and a downloaded guide are not the same asset, and a lead conversion rate calculated across all of them is an average of things that do not belong in the same average. The cleanest practice is to calculate the rate separately for each lead capture form and each channel, then look at the blended number only for budgeting.
Four lead conversion rates, not one
The funnel a paid media budget crosses has four measurable joints. Naming them separately is what makes the metric diagnostic rather than decorative.
| Stage | What it measures | Common name |
|---|---|---|
| Click to lead | Paid visitors who submit a lead capture form or call | Conversion rate, landing page conversion rate |
| Lead to marketing qualified lead | Leads that pass your qualification bar | Lead to MQL rate, where MQL is a marketing qualified lead |
| Marketing qualified lead to sales qualified lead | Qualified leads sales accepts and works | MQL to SQL rate, where SQL is a sales qualified lead |
| Sales qualified lead to customer | Accepted opportunities that close | Close rate, win rate |
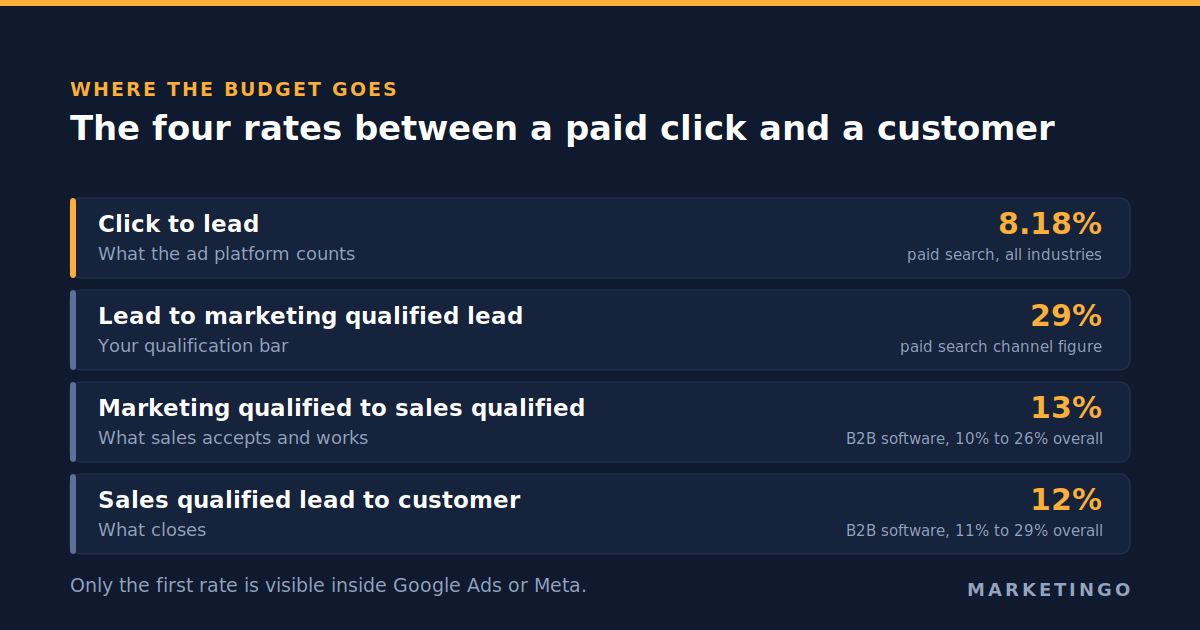
Most reporting stops at the first joint, because the first joint is the only one the ad platforms can see. Google Ads knows a form was submitted. It does not know whether the person who submitted it had a budget, and it will happily optimize toward more of whatever you told it to count. That gap between the conversion the platform counts and the customer your business needs is the single most expensive measurement problem in paid lead generation, and it is the reason the other three rates have to be measured somewhere else and fed back.
What is a good lead conversion rate at the click to lead stage
Two datasets are worth using here, both because they are large and because they publish their own methodology rather than citing someone else's.
WordStream and LocaliQ analyzed 13,474 United States search advertising campaigns running between 1 April 2025 and 31 March 2026 and put the conversion rate across all industries at 8.18%, with an average cost per lead of $66.69. Their methodology note is worth reading closely: "'Averages' are technically median figures to account for outliers." Every article that republishes 8.18% as "the average conversion rate" is quoting a median and calling it a mean.
Unbounce analyzed 41,000 landing pages carrying 464 million visitors and 57 million conversions in the fourth quarter of 2024 and reported a median landing page conversion rate of 6.6% across all industries. They made the same choice for the same stated reason, because "the definition of a 'conversion' can vary greatly from one landing page to the next."
The two figures are close enough to look like agreement and are not measuring the same thing. WordStream's denominator is paid search clicks, which arrive with intent already formed. Unbounce's denominator is all landing page visitors from every source. A paid search campaign converting at 6.6% is below one benchmark and comfortably inside the other, and which comparison you use changes the decision you make.
Search conversion rates by industry, from the 2026 LocaliQ search advertising benchmarks:
| Industry | Conversion rate |
|---|---|
| Animals and pets | 16.22% |
| Automotive repair, service and parts | 15.51% |
| Education and instruction | 13.14% |
| Physicians and surgeons | 12.43% |
| Personal services | 12.34% |
| Dentists and dental services | 10.67% |
| Beauty and personal care | 10.35% |
| Industrial and commercial | 8.20% |
| Home and home improvement | 8.05% |
| Health and fitness | 6.94% |
| Automotive for sale | 6.01% |
| Attorneys and legal services | 5.55% |
| Business services | 4.85% |
| Apparel, fashion and jewelry | 4.50% |
| Real estate | 3.70% |
| Career and employment | 3.05% |
| Finance and insurance | 2.64% |
The spread from 2.64% to 16.22% is six-fold, which tells you that a cross-industry conversion rate benchmark is a poor target and a decent sanity check. Use your own trailing twelve months as the comparison and the industry row as the reality test.
Lead to qualified lead, and qualified lead to customer
Past the first joint the ad platforms go blind and the data gets thinner. The most complete published chain comes from First Page Sage, which reports each stage separately from client data gathered between 2019 and 2025, and which states its definitions instead of assuming them. A marketing qualified lead, in their definition, is a contact that has indicated intent to buy and has been judged able to afford the product. A sales qualified lead adds three conditions: it has moved from marketing to sales with intent to buy, a salesperson has vetted it as a good fit, and it has met or booked a meeting.
Their lead to marketing qualified lead rate averages 31% across all industries, and the channel split inside that average matters more than the average:
| Channel | Lead to marketing qualified lead |
|---|---|
| Client referrals | 56% |
| Executive events | 54% |
| Organic search | 41% |
| Email marketing | 38% |
| Social media marketing | 30% |
| Paid search | 29% |
Paid search sits near the bottom of that table, twelve points below organic search. That is not a flaw in paid search, it is what buying attention rather than waiting for it looks like at the qualification stage, and it is the number to plan with if your pipeline is paid. A paid media programme measured against the blended 31% will look like it is underperforming when it is running exactly to its channel norm.
Marketing qualified lead to sales qualified lead rates, by industry:
| Industry | MQL to SQL |
|---|---|
| Business insurance | 26% |
| Heating, ventilation and air conditioning | 26% |
| eCommerce | 23% |
| Heavy equipment | 23% |
| Higher education | 21% |
| Transportation and logistics | 19% |
| Manufacturing | 16% |
| Cybersecurity | 15% |
| Biotech | 15% |
| B2B software as a service | 13% |
| Financial services | 13% |
| Healthcare | 13% |
| Information technology and managed services | 13% |
| Construction | 12% |
| Fintech | 11% |
| Engineering | 11% |
| Legal services | 10% |
| Real estate | 10% |
And sales qualified lead to closed customer, from the same source:
| Industry | Close rate |
|---|---|
| Heating, ventilation and air conditioning | 29% |
| Addiction treatment | 21% |
| Hotels and resorts | 21% |
| Automotive | 20% |
| Information technology and managed services | 20% |
| Business insurance | 19% |
| Legal services | 19% |
| Pharmaceutical | 19% |
| Construction | 16% |
| Financial services | 16% |
| Staffing and recruiting | 16% |
| Software development | 15% |
| Engineering | 14% |
| Fintech | 14% |
| Real estate | 14% |
| Healthcare | 13% |
| Manufacturing | 13% |
| Solar | 13% |
| B2B software as a service | 12% |
| Cybersecurity | 12% |
| Oil and gas | 12% |
| Biotech | 11% |
First Page Sage are open about the limits of their own dataset, which is more than most publishers in this category manage: their clients skew roughly 70% business to business, and because they are primarily a search optimization agency, that channel is over-represented. Read the tables as one agency's book rather than as the market, and weight your own numbers above them whenever you have twelve months of your own.
The 13% benchmark that nobody can source
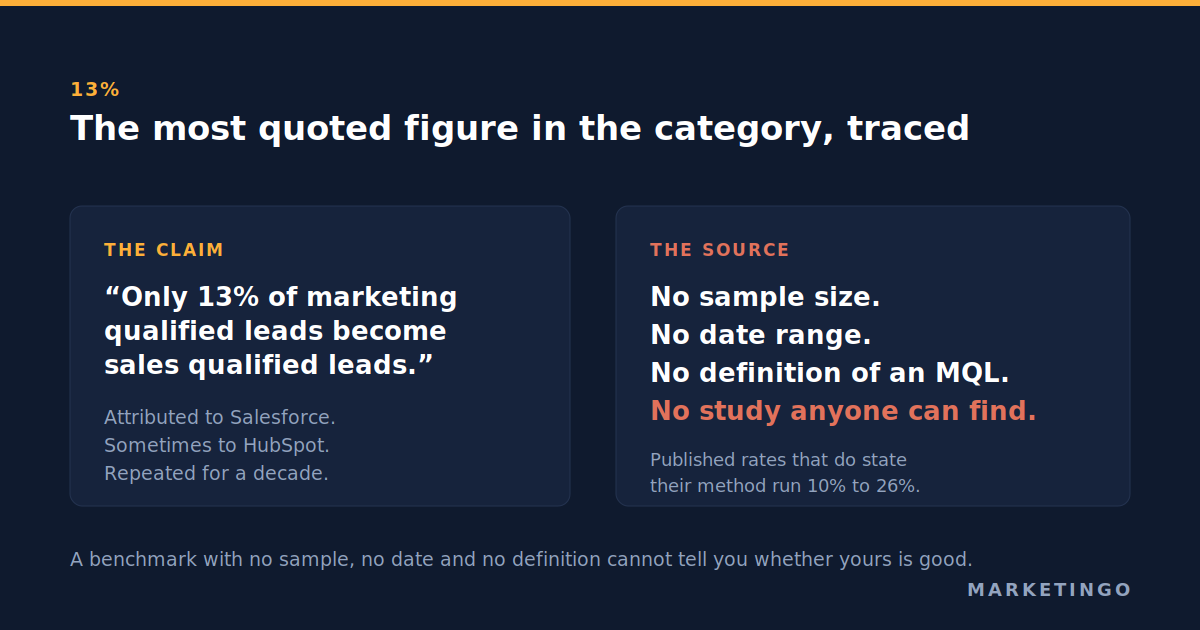
If you have read anything about qualification rates in the last decade you have met this sentence: only 13% of marketing qualified leads become sales qualified leads. It appears in vendor blogs, in dashboards, in board decks, and in almost every article that ranks for this topic. It is usually attributed to Salesforce, sometimes to HubSpot, occasionally to both in the same paragraph.
Gradient.works went looking for the study behind it. What they found, in their words, is that "13% is the vague industry-accepted average MQL to SQL conversion rate (pre-Covid, no original source)", and that the trail runs into "multiple references to Salesforce and HubSpot reports that don't seem to exist."
Two things follow, and both are useful.
First, treat the figure as folklore rather than data. It is not wrong so much as unowned: no sample size, no date range, no definition of a marketing qualified lead, and no publisher willing to put their name on it. A benchmark with none of those four attached cannot tell you whether your own rate is good, because you cannot tell whether it was measured the way you measure.
Second, notice what happens when you put it next to a dataset that does publish its definitions. In the First Page Sage tables above, 13% is the figure for business to business software as a service, financial services, healthcare, and information technology services. It is also 2.6 times too low for heating and air conditioning and business insurance, both at 26%. The famous universal average turns out to be one cluster of industries' number, generalised to every industry by repetition. If you sell air conditioning and you have been reassuring your board that 13% is normal, you have been accepting half the qualification rate your category produces.
Lead conversion rate means three different things
Before comparing your rate to anybody's benchmark, check that you are both counting the same event. Three definitions circulate under the same name, and a fourth comes out of the software most sales teams live in.
The marketing definition. Leads that eventually become customers, divided by leads. This is the one this article opens with and the one most benchmark articles mean.
The advertising definition. Clicks that become leads, divided by clicks. This is what Google Ads and Meta call conversion rate in their own interfaces, and it is the first of the four stages rather than the whole funnel.
The sales definition. Opportunities that close, divided by opportunities worked. Sales conversion rate and win rate usually mean this, and it excludes every lead sales declined to work.
The CRM definition, which is the trap. In Salesforce, converting a lead is a button. The Salesforce documentation describes relating the contact to "either an existing account in Salesforce, or an account that you create", and creating an opportunity only "if the lead you're converting results in a deal that looks promising." An opportunity is optional. So a lead conversion rate pulled straight from a Salesforce report measures how many lead records were turned into contact records, which is a data hygiene measure, not a revenue one. Search demand backs this up: queries about lead conversion in Salesforce sit in the same keyword universe as queries about lead conversion benchmarks, and the two audiences want opposite things.
Whenever somebody quotes you a lead conversion rate, ask what the numerator and the denominator are before you react to the number. Half the arguments between marketing and sales about lead quality are two teams correctly calculating two different metrics.
The rates multiply, and the worst stage sets your cost per customer
Here is where the four rates stop being trivia. They compound.
Take a business to business software company running paid search, using the benchmark figures above as a starting model:
- Click to lead: 8.18%
- Lead to marketing qualified lead, paid search: 29%
- Marketing qualified lead to sales qualified lead, B2B software as a service: 13%
- Sales qualified lead to customer, B2B software as a service: 12%
Multiply them: 0.0818 x 0.29 x 0.13 x 0.12 = 0.00037. That is 0.037%, or roughly one customer for every 2,700 paid clicks. At a $5 cost per click, that is about $13,500 in media to acquire one customer, before agency fees or creative.
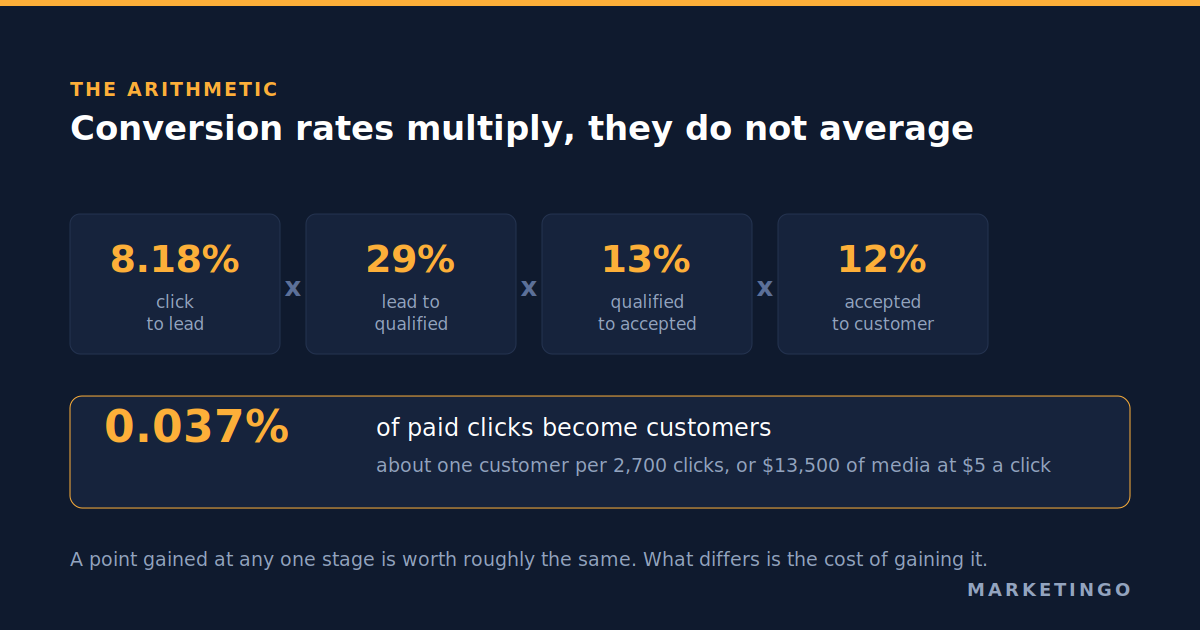
Now run the same arithmetic with one stage improved. Lift click to lead from 8.18% to 10% and the chain produces one customer per 2,210 clicks, about $11,050 in media. Lift the qualification rate from 13% to 16% instead and you get one per 2,190 clicks. Lift the close rate from 12% to 15% and one per 2,160. Three very different projects, near identical effect, which is the point: a percentage point is not a unit of value. The value of a point depends on where in the chain it sits and what it costs you to get it.
Two rules fall out of that.
Work on the stage with the largest gap to its own benchmark, not the stage with the lowest number. A 12% close rate looks alarming next to an 8.18% click to lead rate until you notice that 12% is the industry norm for close rate and 8.18% is the norm for click to lead. Both are exactly average. The stage to attack is the one where you are furthest below your own category's figure.
Price each point before you chase it. A landing page test that costs two weeks of work is cheap. Rebuilding lead qualification so sales accepts a different population is a quarter of organizational change. Both move the same arithmetic, and only one of them can be done this month.
Once you have your four rates, the lead generation return on investment calculator turns them into a break-even cost per lead and a target spend. If you sell products rather than deals, the eCommerce return on ad spend calculator does the equivalent job on the revenue side.
Where paid media actually moves each rate
Four stages, four different sets of levers. Paid media owns the first two outright and influences the third.
Click to lead is a match problem before it is a page problem. The largest single gain in most accounts comes from cutting traffic that was never going to convert rather than from redesigning the form. Search terms that look topically relevant and carry no buying intent, competitor research traffic, job seekers, and students are all paying for impressions against your budget. A disciplined negative keyword system and tighter match type control routinely move click to lead rates more than a landing page rebuild does, and they cost nothing but attention. The account level version of this pass is in our Google Ads audit checklist.
Lead to qualified lead is an offer problem. A guide download and a pricing request qualify at wildly different rates, and running both into the same lead count guarantees a disappointing blend. Separate them, report them separately, and be honest about which one your sales team can actually work. For high-ticket business to business companies the bar is usually a scheduled call, not a form.
The feedback loop is the highest-value lever and the least glamorous. If qualified leads and closed deals never travel back from the customer relationship management system into Google Ads and LinkedIn, the platforms optimize toward raw form fills for ever. Sending qualified lead and closed won events back as offline conversions, and bidding toward those instead, is the mechanical step that makes the other three rates improvable. The full setup is in Google Ads conversion tracking, and it is the first thing our full funnel strategy work puts in place.
Channel choice sets the ceiling. Search captures existing intent and converts a click to a lead most efficiently. LinkedIn Ads converts clicks to leads less efficiently and converts leads to qualified leads far better, because the targeting selects for job title and company size before the click. An artificial intelligence compliance software company, the kind of AI and SaaS business where the buyer is a named job title rather than a broad audience, grew demo requests 66% in 60 days on a lean Google Ads and LinkedIn launch, without a budget increase, because the two channels were solving different stages rather than competing for the same one. A regulatory-compliance consultancy cut cost per lead from $112 to $40.25, a 64% reduction, with 557 additional leads and $4,000 less spend over six months, by rebuilding search campaigns around the terms that produced clients rather than the terms that produced clicks.
Expect your rates to get worse before they get better
The most common outcome of measuring the four rates honestly for the first time is that the reported numbers deteriorate. That is usually the measurement improving rather than the account.
A business to business sports apparel manufacturer came to MarketinGO with a reported cost per lead of $32.88 on Google Ads and about $18.45 on Meta. Seven months later the reported figures were $50.72 and $62.60, and the account was in materially better shape. The conversion definition had been tightened from any tracked interaction to contact form submissions that sales could work, so the lead count fell, the reported cost per lead rose, and the click to lead conversion rate dropped. Every number on the dashboard got worse and the business got better.
Set the expectation before you change the definition, not after. Tell whoever reads the dashboard that the rate is about to fall, that the fall is the point, and that the comparison to watch is cost per lead against customer acquisition cost rather than lead volume. Teams that skip this step usually revert the tracking change within a quarter and spend the next year optimizing toward leads nobody wanted.
Lead scoring and lead nurturing move two of the four rates
Lead scoring and lead nurturing are the two programmes most often bought to fix a lead conversion rate, and they act on different joints of the sales funnel, so buying the wrong one is a common and expensive mistake.
Lead scoring changes the lead to marketing qualified lead rate and nothing else. It is a sorting mechanism: it decides which leads carry enough intent and fit to be passed on. A well-built score raises the qualified rate by holding back leads that sales would have declined anyway, which means the headline lead conversion rate usually falls the month a score goes live while the pipeline gets healthier. A badly built score, tuned on activity rather than on fit, simply reorders the same population and moves nothing. The test is whether the sales team accepts a higher share of what it receives, not whether the score correlates with anything.
Lead nurturing acts later, on the qualified lead to opportunity and opportunity to customer rates. It converts leads that were real but early, which is why its effect shows up as a longer sales cycle and a higher eventual close rate rather than as a jump in any monthly number. Judging a nurture programme on this quarter's conversion rate will almost always understate it.
Both are worth doing and neither is where a paid media programme should start. If sales and marketing disagree about lead quality, the ordering that works is to fix what the platforms count first, then tighten qualification, then nurture what qualification holds back. Scoring a population of leads the ad platforms were never optimizing toward is sorting the wrong pile.
How to measure your own four rates in 30 days
You do not need a data warehouse for this.
- Pick one channel and one cohort. Last month's paid search leads, nothing else. Mixing channels at this stage hides everything you are trying to see.
- Count the clicks and the leads. Both are in the ads interface. Divide for your click to lead rate.
- Export the same leads from the customer relationship management system with their current stage. Count how many passed qualification, how many sales accepted, how many closed. Three more divisions.
- Write the four percentages in one row and multiply them. Compare the product to your actual customers from that cohort. If the two disagree, your stage definitions are leaking, and finding the leak is worth more than any optimization.
- Repeat monthly on the same definitions. Consistency beats precision here. A rate measured the same imperfect way for six months tells you more than a perfect rate measured once.
Two habits keep this honest over time. Use cohorts rather than calendar snapshots, so a slow month of closings does not read as a broken funnel. And freeze the definitions for at least two quarters, because a lead conversion rate whose denominator changes every time someone edits a form is a number with no memory.
Get your four rates measured
If your lead conversion rate is one number rather than four, the fastest way to find out where the budget is going is to have somebody map the chain against your actual account and customer relationship management data. That is the first thing we do on every engagement, and we do it before proposing any change to spend.
Our free ad audit covers exactly this: what the platforms are counting, what happens to those leads after the form, and which of the four stages is costing you the most. It is a genuine audit rather than a sales call with slides, and you keep the findings either way.