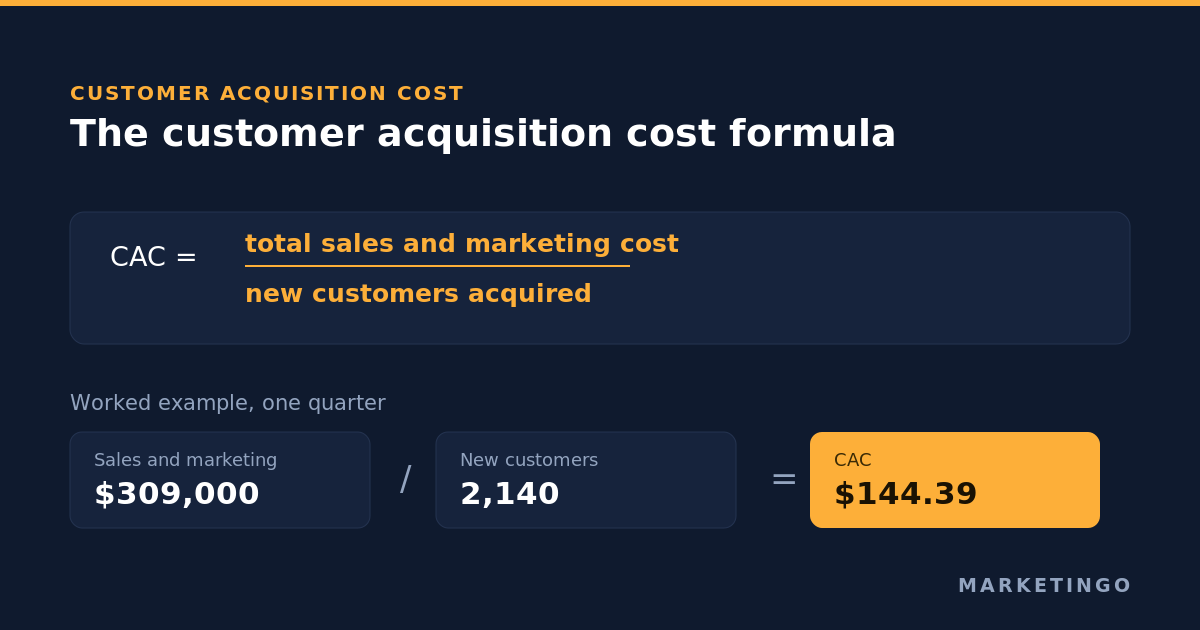
Customer acquisition cost is total sales and marketing spend divided by the number of new customers acquired in the same period. Spend $40,000 and acquire 250 new customers, and CAC is $160.
The formula is the easy part. Almost every argument about CAC is an argument about the numerator: whether to include salaries, tooling, agency fees, creative production. That argument is worth having once and then settling. The error that actually breaks the number sits in the denominator, and it is the one nearly nobody audits.
Your ad platforms do not count customers. They count conversions. If you have ever pulled a "cost per acquisition" figure out of Google Ads and called it CAC, this article is about the gap between those two numbers and how to close it.
The customer acquisition cost formula
CAC = total sales and marketing cost ÷ new customers acquired
Both terms have to cover the same period and the same population. A worked example for a DTC brand over one quarter:
| Line item | Amount |
|---|---|
| Paid media spend | $210,000 |
| Agency and freelance fees | $27,000 |
| Marketing salaries (loaded) | $48,000 |
| Creative production | $15,000 |
| Martech and analytics tools | $9,000 |
| Total sales and marketing cost | $309,000 |
| New customers acquired | 2,140 |
| CAC | $144.39 |
Strip everything except media, and the same quarter reports a CAC of $98.13. Neither number is wrong. They answer different questions, which is why the version you use has to be labelled.
Paid CAC, blended CAC, and fully loaded CAC
Three variants get called "CAC" in the same meeting, and people talk past each other for an hour.
Paid CAC divides paid media spend by the new customers attributable to paid. It is the number a media buyer can act on this week, because every input is inside the ad accounts.
Blended CAC divides total sales and marketing cost by all new customers, including the ones who arrived through organic search, direct, referral and word of mouth. It is the honest business number and the one investors ask for. It also flatters paid media, because organic customers sit in the denominator while none of their cost sits in the numerator.
Fully loaded CAC is blended CAC with salaries, tools and overhead included. It is what finance means when they ask what it costs to acquire a customer.
The gap between paid and blended CAC is itself a diagnostic. When it widens, your paid channels are getting less efficient relative to the rest of the business, even if the blended figure holds steady. If you are already tracking efficiency at the business level, the same logic drives the marketing efficiency ratio, which is the revenue-side twin of blended CAC.
The denominator problem: cost per acquisition is not customer acquisition cost
Cost per acquisition and customer acquisition cost share three letters and nothing else. WordStream's search advertising benchmark report, which reports on 18,228 North American client campaigns running between December 2020 and February 2022, defines cost per lead as "also known as cost per action, cost per conversion, and cost per acquisition," calculated by dividing total campaign cost by the total number of conversions.
Total number of conversions. Not customers. That is the industry-standard definition, and it is precisely why the two metrics diverge.
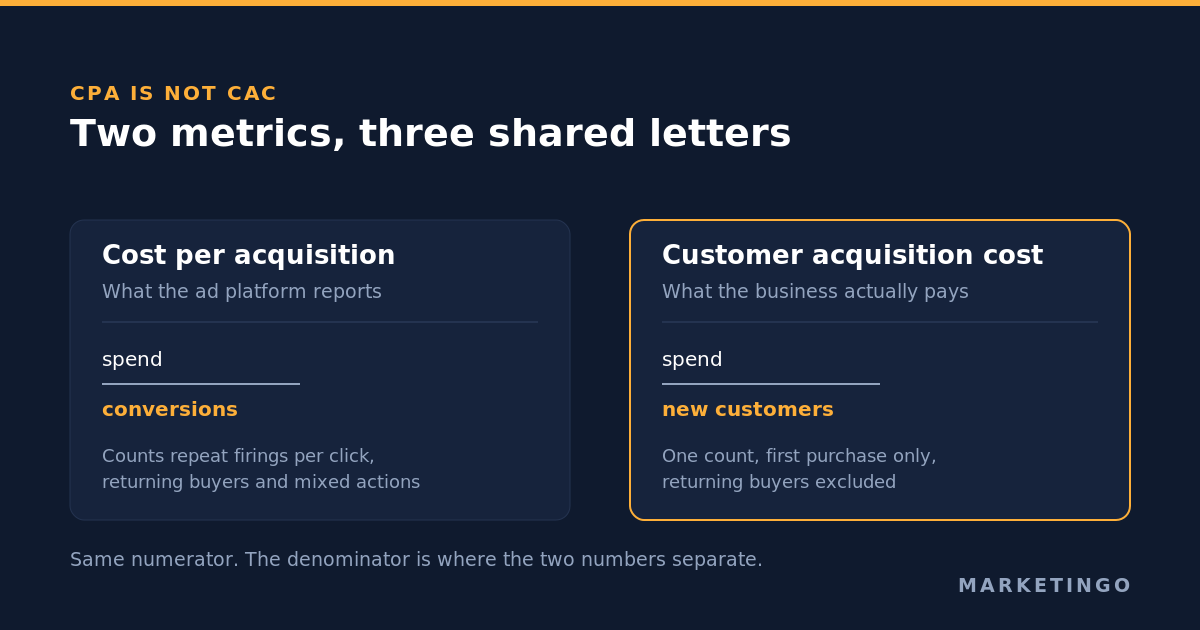
Three things happen between a platform conversion count and a real count of new customers.
One conversion action can fire more than once per click. Google Ads lets you choose how each conversion action is counted, and its own documentation states that "every conversion" is the default setting for website conversion actions, while "one conversion" is the default for calls from ads, Analytics goals and app installs. Under "every conversion," a single click that produces two purchases is reported as two conversions. Your denominator inflates and your reported cost per acquisition falls, with no change in the business.
You do not have to guess how far off you are. The same page documents a repeat rate column in the conversion actions table, defined as the number of conversions you would record under "every conversion" divided by the number under "one conversion." A repeat rate of 1.5 means your conversion count is running 50% above your click-to-conversion count. Read it before you trust any cost-per-acquisition figure in the account.
Conversions include returning customers. A repeat purchaser converts exactly like a new one. On a mature DTC account with a healthy returning cohort, treating platform conversions as new customer acquisitions can understate true CAC by a wide margin, and the error grows as the business matures. Both Google and Meta expose new-versus-returning customer reporting, and turning it on is usually the single highest-value hour of measurement work available on an established account.
Multiple conversion actions stack. If newsletter signups, demo requests and purchases are all in the same conversion column, the denominator is a mixed bag of events, and dividing spend by it produces a number with no business meaning.
For B2B, the mismatch is even wider, because a platform conversion is a lead, and a lead is several steps and several weeks from a customer.
How to calculate CAC from ad platform data
The bridge from cost per lead to customer acquisition cost is one multiplication, and running it changes how a lead generation account gets managed.
CAC = cost per lead ÷ lead-to-customer conversion rate
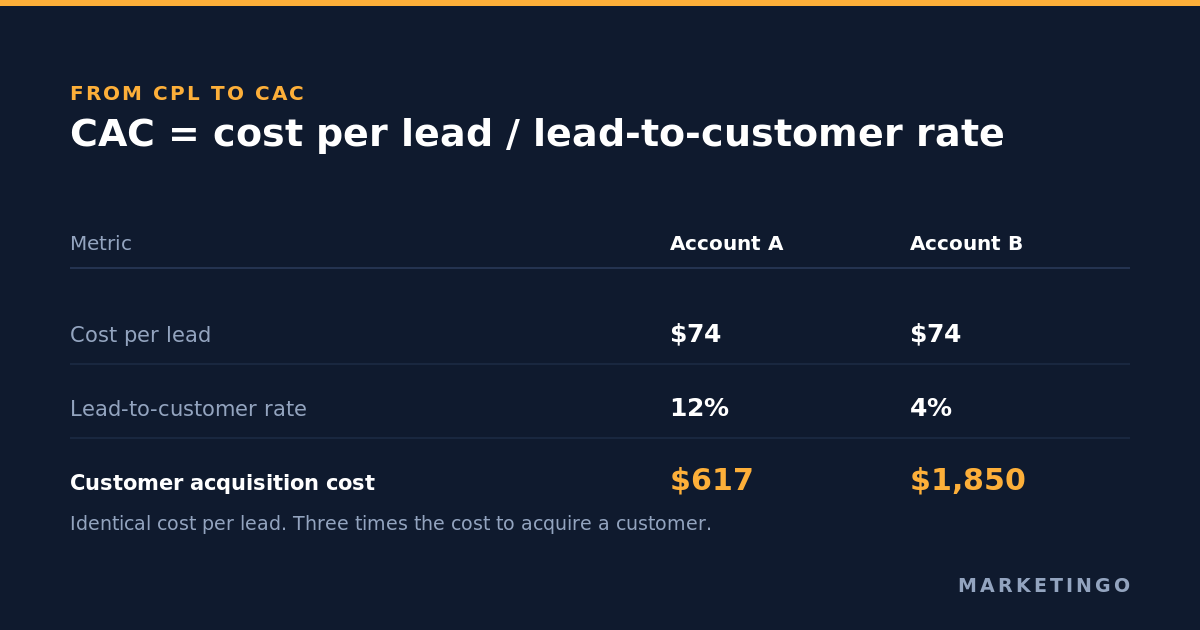
Two accounts, identical on the surface:
| Account A | Account B | |
|---|---|---|
| Cost per lead | $74 | $74 |
| Lead-to-customer rate | 12% | 4% |
| CAC | $617 | $1,850 |
Same cost per lead, same reported cost per acquisition, three times the true cost to acquire a customer. A media buyer optimising to cost per lead alone cannot see this, and will happily scale the channel that is quietly tripling CAC. This is the whole argument for feeding closed-won data back into the ad platforms rather than optimising to form fills.
The ecommerce version of the same bridge uses new-customer orders instead of all orders:
CAC = paid media spend ÷ new customers acquired from paid
Once you have both halves, the lead generation ROI calculator will run the CPL, close rate and deal value together for a B2B model, and the ecommerce ROAS calculator does the equivalent for a DTC one. Neither replaces a proper analysis, but both stop the arithmetic errors that make the first version of these models wrong.
Calculate CAC by marketing channel, not as one average
A single company-wide figure tells you almost nothing you can act on, because the average cost hides the spread underneath it. Run the CAC formula once per marketing channel and the picture usually reorganises itself.
Take a business spending $120,000 in a month across three channels and acquiring 640 new customers, for a blended CAC of $187.50:
| Channel | Spend | New customers | CAC |
|---|---|---|---|
| Branded search | $14,000 | 210 | $66.67 |
| Non-brand search | $58,000 | 265 | $218.87 |
| Paid social prospecting | $48,000 | 165 | $290.91 |
| Total | $120,000 | 640 | $187.50 |
Nothing in the business performs at $187.50. Branded search is largely harvesting demand the rest of the marketing and sales effort created, so its apparent efficiency partly belongs to the other two rows. That matters when someone proposes shifting budget toward the cheapest line, which is the most common way an account quietly stops growing: you can acquire new customers at $67 all day, right up to the point where there is no more branded demand to buy.
Two rules make channel-level CAC usable. Hold branded and non-brand separate, always, because merging them produces a number that flatters itself. And read every channel's cost of acquiring a customer against its own incrementality, not against the cheapest row in the table. A channel with a higher CAC and a genuine return on investment at the margin is worth more than a cheap one that would have converted anyway.
What is a good customer acquisition cost?
There is no good CAC in the abstract, and any table claiming to give you one across industries is comparing numbers built from different numerators and different denominators. The number you can actually defend comes from your own gross margin.
Break-even CAC = gross margin per customer over the payback window
At a 60% gross margin on a $200 average order value, one purchase contributes $120, so a CAC above $120 loses money on the first order. Whether that is acceptable depends on repeat purchase behaviour, which is where customer lifetime value enters.
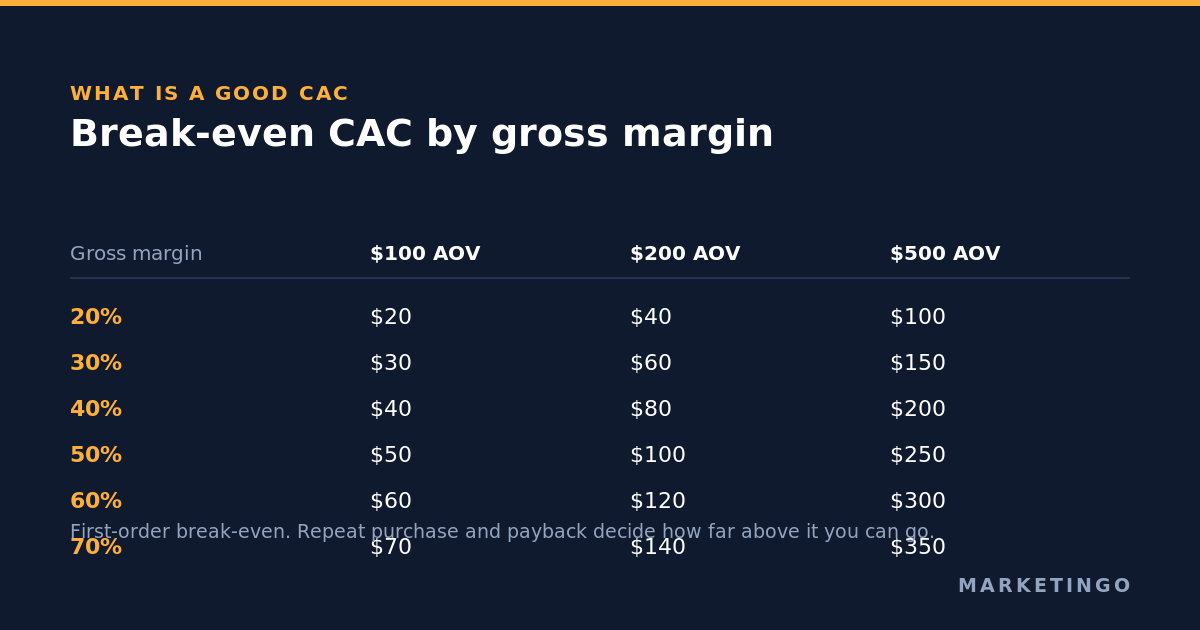
| Gross margin | Break-even CAC on $100 AOV | On $200 AOV | On $500 AOV |
|---|---|---|---|
| 20% | $20 | $40 | $100 |
| 30% | $30 | $60 | $150 |
| 40% | $40 | $80 | $200 |
| 50% | $50 | $100 | $250 |
| 60% | $60 | $120 | $300 |
| 70% | $70 | $140 | $350 |
That is first-order break-even. A subscription or repeat-purchase business can rationally pay well above it, provided the payback period is short enough that the cash comes back before it is needed again.
Industry benchmarks are still useful one level down, at the media layer, where the definitions are consistent. The same WordStream report gives median cost per lead by industry for search ads across that 2020 to 2022 window:
| Industry | Median cost per lead |
|---|---|
| Attorneys and legal services | $83.10 |
| Careers and employment | $81.45 |
| Furniture | $76.71 |
| Finance and insurance | $74.44 |
| Business services | $73.70 |
| Apparel, fashion and jewellery | $57.97 |
| Education and instruction | $54.60 |
| Home and home improvement | $54.05 |
| Dentists and dental services | $50.91 |
| Health and fitness | $45.60 |
| Restaurants and food | $26.58 |
| Automotive repair and service | $18.73 |
| Animals and pets | $17.46 |
Treat these as a sanity check on your cost per lead, then run them through your own lead-to-customer rate to get anywhere near CAC. A legal firm at $83 per lead closing 20% is acquiring customers at $415. The same $83 at a 5% close rate is $1,660.
The LTV to CAC ratio, and where 3:1 actually came from
The most repeated rule in this category is that customer lifetime value should be at least three times CAC. It has a real source, which is more than most marketing rules can claim: David Skok's SaaS Metrics 2.0, which sets the guideline at an LTV to CAC ratio higher than 3.
Two things about that guideline get lost in transmission.
It was written for venture-funded B2B SaaS with recurring revenue, multi-year customer lifetimes and a stable customer churn rate. Applied to a DTC brand with a single-purchase product, or to a pre-product-market-fit startup with twelve months of history and no reliable lifetime value estimate, it is arithmetic performed on a guess. Lifetime value is a churn forecast wearing a dollar sign, and a ratio is only as good as the weakest number inside it.
And a ratio above 3 is not automatically good news. A business running at 8:1 is usually underspending, not winning. It is leaving acquisition on the table that it could profitably buy, and a competitor with a 3:1 ratio and a working payback model will take that market. High LTV to CAC is a growth constraint as often as it is a health signal.
The metric that survives contact with reality better than either is CAC payback period: how many months of gross profit it takes to earn back the acquisition cost. It requires no lifetime value forecast, only margin and time, and it is the number that decides whether you can fund next month's spend from this month's customers.
Does it really cost five times more to acquire a customer than to retain one?
This claim appears in roughly every article about reducing acquisition costs, almost always uncited. It is worth tracing, because the trail ends somewhere unexpected.
Ipsos researchers Keiningham, Vavra, Aksoy and Wallard tracked it for their book Loyalty Myths and published the finding: the earliest sources they could locate attribute it to research by the Technical Assistance Research Project in Washington DC in the late 1980s. It gained authority in 1990 through a Harvard Business Review article, "The Profitable Art of Service Recovery," and through Tom Peters' Thriving on Chaos. As they put it, the myth "has stood unchallenged for 20 or more years," and they note that they had repeated it in their own earlier work.
Their objections are specific. The financial case assumes existing customers spend more over time, pay full margin and create operating efficiencies, and they report that research supports none of the three. It ignores product and company lifecycle, where an early-stage business necessarily weights spending toward acquisition and a declining one weights toward retention. And it treats a customer base as uniform, when the customers who are most expensive to retain are frequently the most profitable ones, because competitors want them too.
The practical reading for a paid media budget: customer retention is worth funding on its own evidence, in your own numbers, not because of a ratio traced to a study from the late 1980s that nobody has produced. Measure what a repeat purchase actually costs you to trigger, compare it against the total cost of acquiring a first-time buyer in the same period, and let your own two numbers settle the argument.
How to reduce customer acquisition cost
The levers that actually move CAC in a paid account, ordered by how often they turn out to be the binding constraint.
Fix the denominator before optimising anything. Separate new from returning customers in reporting, set conversion counting deliberately rather than accepting the default, and import offline conversions so the platform optimises toward customers rather than form fills. Accounts frequently discover their real CAC is 30% to 60% above what they believed, and every optimisation decision made before that point was made on the wrong number. A structured Google Ads audit is usually where this surfaces.
Cut spend that produces conversions but not customers. Search terms, placements and audiences convert at wildly different lead-to-customer rates. On a dental supplies account with roughly 40,000 SKUs, 37% of budget was going to products that generated no revenue at all, and reallocating it lifted blended Google ROAS from 7.86 to about 8.5 while spend increased.
Improve the conversion rate rather than the click price. Cost per click is largely set by the auction. The path from click to customer is yours, and it compounds: a lead-to-customer rate moving from 4% to 6% cuts CAC by a third with no change in media at all.
Consolidate rather than add channels. Running two channels well beats running five thinly. Google Ads and Meta cover most DTC demand, while LinkedIn Ads alongside search covers most high-ticket B2B. Microsoft Ads is often the cheapest incremental high-intent inventory available once search is working.
Then buy the right customers, not the cheapest leads. For a regulatory compliance company, MarketinGO cut cost per lead from $112 to $40.25, a 64% reduction, and delivered 557 additional high-value leads on $4,000 less spend over six months. For a document redaction software business, restructuring around high-intent search took cost per trial from $64 to about $27 while roughly tripling weekly trial signups. In both, the gain came from changing what the account was buying rather than from bidding less for the same thing.
For DTC and ecommerce brands, the same discipline runs through margin instead of close rate, which is why the ROAS formula and what counts as a good ROAS are the companion questions on that side.
Find out what your real CAC is
Most accounts we look at are optimising toward a cost per acquisition that is not customer acquisition cost, and the gap is rarely small. If you want to know what yours is, a free ad audit will rebuild the number from your conversion setup, your new-versus-returning split and your close rate, then show which spend is producing conversions rather than customers. It takes a few days and there is nothing to sign.