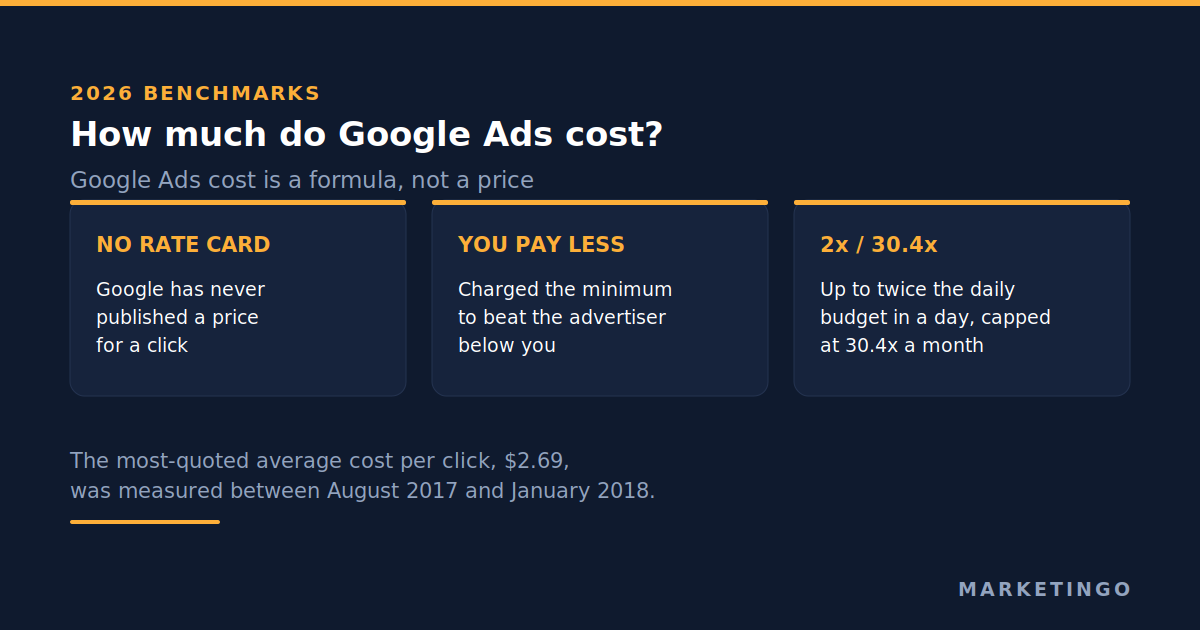
The short answer is a formula, not a price. In Google Ads you are charged per click, and the amount you pay for each one is set in an auction that runs every time somebody searches. The account reports that amount in a column labelled CPC, which is simply cost per click written short, and it is the number this whole article is about. Google states the rule plainly: you pay "what's minimally required to clear the Ad Rank thresholds and beat the Ad Rank of the competitor immediately below you." Your own maximum bid, the Max. CPC setting, is a ceiling you rarely touch. In Google's words, "you're often charged less, sometimes much less, than your maximum cost-per-click bid."
So the cost of Google Ads is:
Monthly cost = number of clicks x your actual cost per click
And the number that decides whether the spend was worth it is:
Cost per acquisition = total spend / number of customers acquired
Everything else in this article exists to give you a defensible figure for that middle term, and to show you why almost every published average you will find for it is either a median wearing the word "average", or eight years old.
Google has never published a price list, and the page that used to try now redirects
Search for what Google Ads cost and the first result is Google's own campaign budget page. It ranks first, it is about a thousand words long, and it contains no prices at all.
Follow the old advertiser pricing URL, ads.google.com/home/pricing/, and you no longer land on a pricing page. It returns a redirect to a page about bidding, where the closest thing to a price is the sentence "Bidding amounts are ultimately up to you," alongside the advice that "you should always set your bid based on what you think an ad click is worth to you."
This is the third major advertising platform where the same thing is true. Meta publishes no rate card for Facebook, and LinkedIn publishes none either, as the cost articles on both platforms set out. In all three cases the page that ranks first for the cost query is the platform's own page, and in all three cases it declines to name a figure. That is not evasion. An auction has no list price, because the price is whatever the second-placed advertiser was willing to pay. A rate card would be a fiction.
Which means every circulating average CPC for Google Ads is a third party's sample of other advertisers' accounts, not a published rate. The useful question is not what the average CPC is. It is whose accounts were in the sample, over what period, and whether the number is a mean or a median.
Very few of the pages competing for this query answer any of the three.
The 2026 benchmarks, with the methodology the aggregators drop
The largest published dataset for search advertising cost is the annual benchmark report from WordStream, now part of LocaliQ. The 2026 edition draws on "a sample of 13,474 US-based search advertising campaigns running between Apr 1, 2025, and March 31, 2026," with each industry subcategory containing at least 52 active campaigns.
Its headline figures:
| Metric | 2026 | 2025 |
|---|---|---|
| Average CPC, all industries | $5.42 | $5.26 |
| Click-through rate | 6.64% | 6.66% |
| Conversion rate | 8.18% | 7.52% |
| Cost per lead | $66.69 | $70.11 |
Source: WordStream 2026 search advertising benchmarks and the 2025 edition, whose sample was 16,446 campaigns from April 2024 to March 2025.
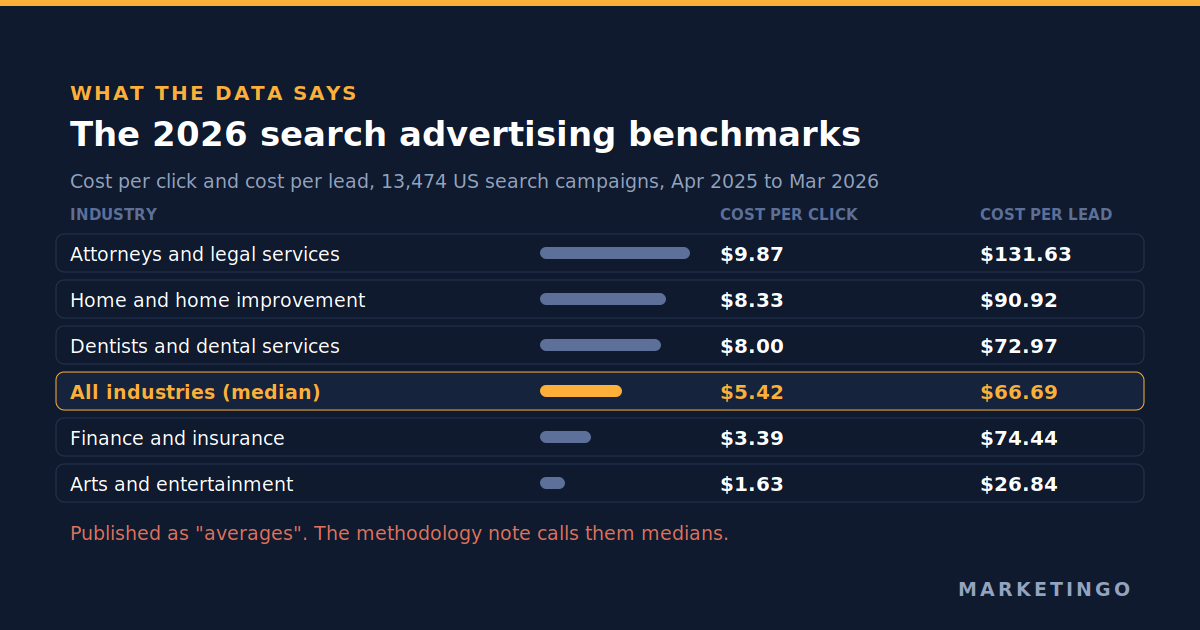
And by industry, the spread that matters more than the average:
| Industry | Average CPC | Cost per lead |
|---|---|---|
| Attorneys and legal services | $9.87 | $131.63 |
| Home and home improvement | $8.33 | $90.92 |
| Dentists and dental services | $8.00 | $72.97 |
| Finance and insurance | $3.39 | $74.44 |
| Arts and entertainment | $1.63 | $26.84 |
A legal practice and an events business are both "average" advertisers on Google, and one pays six times more per click than the other, and the gap between their CPC figures is structural rather than an account problem. Any budget conversation that starts from the all-industry $5.42 rather than from your own category is starting from a number that applies to nobody.
Now the part that almost every page quoting these figures leaves out. WordStream states, in its own methodology note: "'Averages' are technically median figures to account for outliers."
That qualifier does not survive the first hop. LocaliQ's own blog publishes the identical dataset with no methodology note at all, no date range and no sample count, describing it only as "data from thousands of our customers' advertising campaigns." Search Engine Journal re-reports all four headline figures and does not carry the median disclosure either.
The consequence is specific and it costs people money. Most advertisers compute their own account's mean CPC, compare it to WordStream's median, and draw a conclusion from a comparison of two different statistics. A handful of expensive keywords will pull a mean well above a median. An account can look 30% worse than the average CPC while sitting exactly at the middle of its category.
The most-quoted number in paid search was measured in 2017
Ask any search engine what the average cost per click in Google Ads is and you will meet $2.69. It is on aggregator pages, in agency blog posts, in sales decks, and in Semrush's still-live cost article. Store Growers, updated in January 2026, states that advertisers pay $2.69 per click on search ads.
We went looking for where it comes from, and the answer is worth knowing before you quote it again.
The figure originates on a WordStream page first published in February 2016, which is still live. Its own methodology line reads: "a sample of 14,197 US-based WordStream client accounts advertising on Google's Search and Display networks between August 2017 and January 2018."
So $2.69 is a measurement of advertising costs in the six months ending January 2018. It is roughly eight years old. The page carries a header reading "Last Updated: July 6, 2026" and the line "Note: We update this data regularly!", while the numbers beneath it have not moved.
The same publisher's current report says $5.42. WordStream is simultaneously publishing $2.69 and $5.42 for the same metric, on two live pages, one of them stamped with a 2026 update date. Anyone budgeting from $2.69 in 2026 is planning against roughly half the going rate.
There is a tell in the recycling, too. Business of Apps publishes a year-by-year table of search cost per click in which 2019, 2021 and 2024 are all exactly $2.69, sourced to a list of four publishers with no sample size or date range attached. A figure that lands on the same cent three times across six years is not a measurement. It is a copy.
This is the single most useful thing to take from this article: treat any CPC figure without a stated sample and date range as folklore, including the ones that feel like common knowledge.
Where the published benchmarks contradict each other
Even among publishers who do disclose their method, the disagreements are large enough to change a decision.
Take one trade, in one month. SearchLight Digital published an analysis of 816 heating and cooling and plumbing contractors, covering 8,077 campaigns, $14.88 million of spend and 143,008 leads in January 2026. It reports a blended cost per lead of $104, rising to $149 for non-branded campaigns and falling to $34 on branded terms. It also says, creditably, that "this is a single vendor's client base, contractors organized enough to wire Google Ads into a CRM, which likely skews better-run than the average account."
For the same trade and the same month, 99 Calls reports a median cost per lead of $189, within a 2026 band of $190 to $335.
Both are first-party datasets. Both cover heating and cooling contractors. The gap between the blended $104 and the median $189 is 1.8 times, and the most comparable pair, $149 against $189, still differs by a quarter. The reason is not the market. SearchLight divides total spend by total leads, which is a spend-weighted mean; 99 Calls reports a median. Two honest methods, one trade, one month, and a gap wide enough to make a contractor think their agency is failing or excelling when it is neither.
Widen it and the spread gets worse. WordStream's home and home improvement category shows an $8.33 CPC; 99 Calls shows $33.51 for general heating and cooling work, four times higher. Part of that is real, because home improvement is a broad category and heating repair is one of its more expensive corners. But every aggregator that quotes $8.33 as a heating and cooling number is publishing a four-fold error.
We also found a table published as "Wordstream Industry Benchmarks 2026" listing a legal CPC of $5.90 where WordStream itself says $9.87, and using industry labels that do not exist anywhere in WordStream's 23-category taxonomy. The numbers are not WordStream's. The name is. If you are checking a benchmark, open the original.
What Google does document, and it is more useful than any average
Google will not tell you what a click costs. It does tell you, precisely, how much it can spend and how the charge is computed. Those rules are worth more to a budget than a benchmark table, and most articles on this query skip them.
You are charged the minimum needed to win, not your bid. Your actual CPC is set by the Ad Rank of the advertiser immediately below you, divided by your own ad quality, plus a cent. Two advertisers bidding the same amount pay different prices, and the one with the better ad and landing page pays less for the same position. This is why bidding more is often the least effective way to buy more traffic.
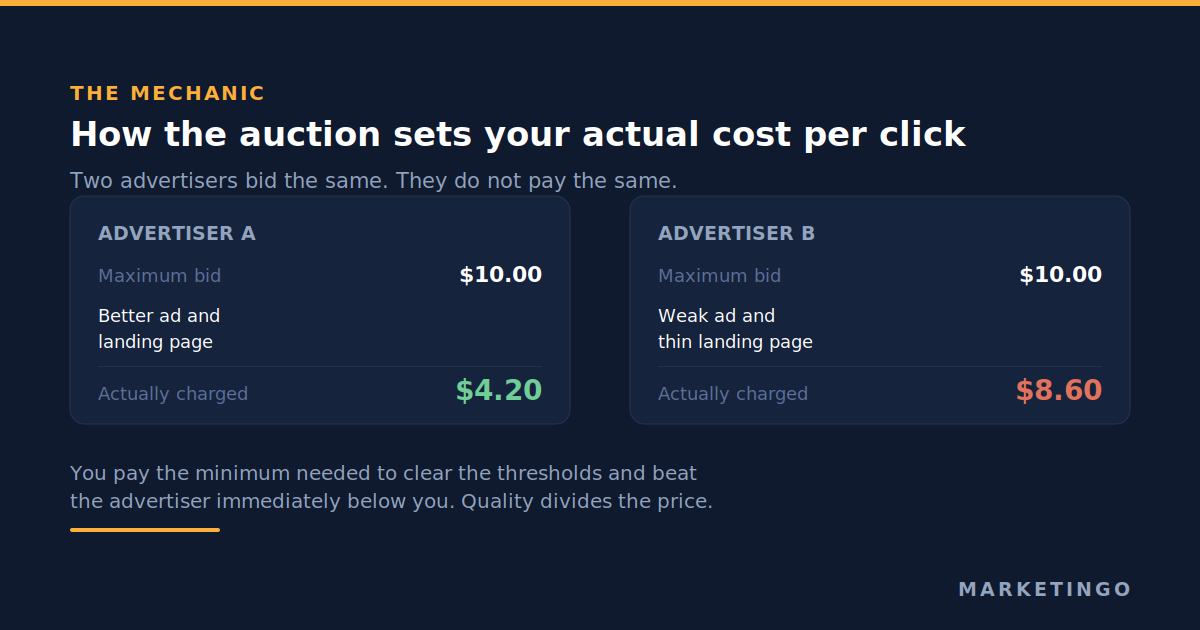
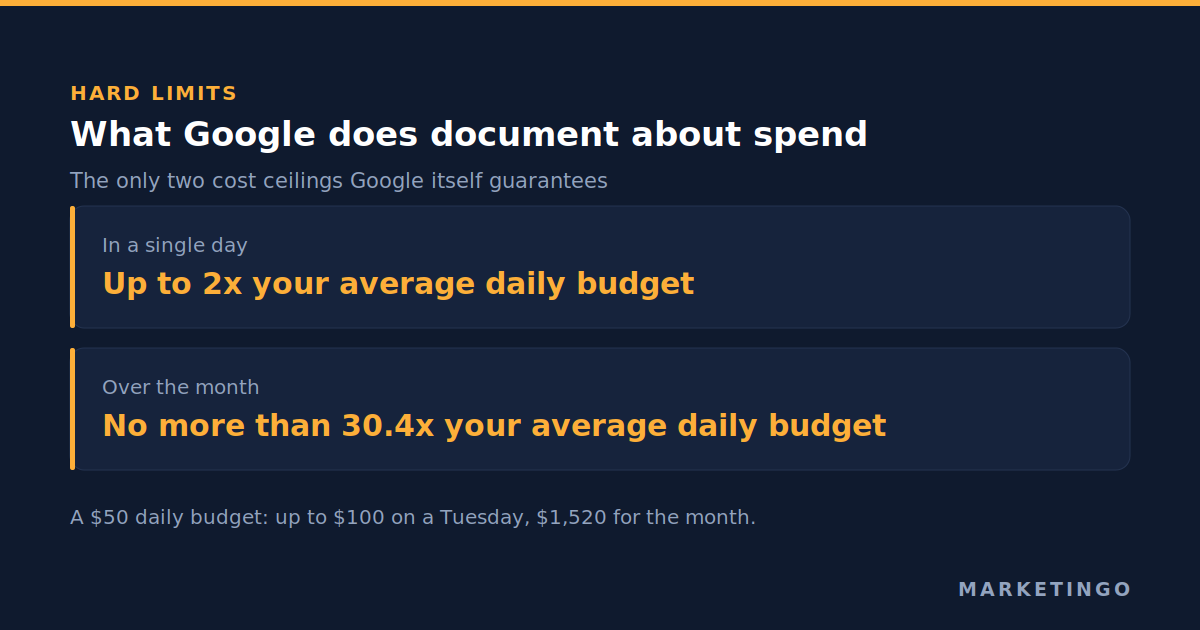
A campaign can spend up to twice its average daily budget in one day. Google's overdelivery documentation states it in terms: "On a given day, your campaign might spend up to twice your average daily budget to take advantage of fluctuations of traffic." If you set $50 a day and see $97 on a Tuesday, nothing has gone wrong.
The month is capped, and the cap is 30.4 times the daily budget. From the same page: "At the end of the month, you will have spent no more than 30.4 times your average daily budget." Google's budget guidance completes the arithmetic from the other direction: "If you're working with a monthly budget, divide that number by 30.4." So a $3,000 monthly budget is a $98.68 daily budget, and $3,000 is the ceiling rather than the target.
Those two rules together are the only hard cost controls in a Google Ads account that Google itself guarantees. Bid strategy targets are not guarantees. If you need a true ceiling above the campaign level, that is what account-level and campaign-level spending limits are for.
Nothing has a minimum. There is no minimum spend, no setup fee and no monthly platform charge in Google Ads. An account can run on $5 a day. Whether it should is a different question, and the answer comes from arithmetic rather than from a benchmark, which the next section covers.
What actually moves your CPC
Five things account for most of the variation between two advertisers in the same category.
Competitive density in your keywords. The auction price is set by the advertiser below you, so CPC is a function of how many well-funded competitors want the same search. This is most of the difference between a $1.63 click in entertainment and a $9.87 click in legal services: not Google's pricing, but how much a case is worth to a law firm.
Ad quality and landing page experience. Because actual cost is divided by your quality, a genuinely relevant ad pointing at a page that answers the search pays less for the same position. This is the one lever fully inside your control and the one most often left alone. Our Google Ads audit checklist covers how to read it in an account.
Keyword intent and match type. "Emergency plumber near me" and "how does plumbing work" are different purchases at different prices. Broad match buys the second kind whether you wanted it or not, which is why a negative keyword system matters more to cost than bid tuning does. The same discipline is what keeps a Performance Max campaign from buying the second kind at scale.
Geography and device. The same keyword costs different amounts in different cities and on different devices, because the competitive set differs.
What you count as a conversion. This one changes nothing about your CPC and everything about your cost per acquisition. An account counting newsletter signups as conversions will report a cost per lead a fraction of an account counting sales-qualified enquiries, on identical spend. Before comparing your cost to anybody's benchmark, check what the benchmark counted. Our guide to Google Ads conversion tracking sets out the settings that decide this.
Quality Score: the discount Google gives for relevance
If your actual CPC is your bid divided by your quality, then quality is a price lever, and Google reports it. Quality Score is a one-to-ten diagnostic at keyword level, built from three inputs: expected click-through rate, ad relevance, and landing page experience. Each is reported as below average, average or above average, which is more useful than the composite number because it tells you which of the three to fix.
The practical effect is that high-quality ads pay less for the same position. Two accounts bidding identically on the same keyword see different final costs, and the one with tighter ad copy and a landing page that answers the search sees the lower one. Relevant ads earn a discount; loose ones pay a surcharge. This is the mechanism behind every claim that a better-run account is cheaper, and it is why consolidating a hundred loosely related keywords into one ad group reliably produces higher costs per click than splitting them into themed groups with ad copy written for each.
Two things Quality Score is not. It is not a ranking factor you can buy, and it is not the same as optimization score, which measures how many of Google's recommendations you have applied. A Quality Score of three on a keyword that converts profitably is a note to improve the ad, not a reason to pause it.
What Google Ads cost by campaign type
The figures above are for paid search ads, meaning text ads that appear when someone searches on Google. They are the most expensive inventory Google sells, because the intent is highest. The other campaign types price very differently, and mixing them into one average is how a lot of published "typical Google Ads costs" figures get distorted.
- Search. The benchmark set above. Your ads appear against a query, you pay per click, and the keywords you choose trigger your ads.
- Display ads on the Google Display Network. Clicks are usually a fraction of search prices, often under a dollar, because you are buying attention rather than intent. Conversion rates fall by a larger factor than the price does, which is why a cheap display click is not automatically a bargain.
- Video ads on YouTube. Typically priced per view rather than per click, at a few cents.
- Shopping. Product listings priced per click, generally below search text ads in the same category.
- Performance Max. Runs across all of the above, which means a single reported average CPC for a Performance Max campaign is a blend of search, display and video prices rather than a comparable figure.
Costs also vary for Google Ads by location. The same keyword is bid up harder in a dense metropolitan area than in a rural one, so a national average is the wrong reference point for a business serving one city.
Is Google Ads worth it for small businesses?
The honest answer is that Google Ads is worth it when your gross profit per customer exceeds your cost per acquisition, and not otherwise. That is a different question from whether Google Ads is expensive, and it is the question most small businesses skip.
Three cost considerations decide it for a smaller advertiser. First, whether the category's CPC leaves room: if a click costs $9.87 and your average sale carries $60 of gross profit, you need better than one customer per six clicks, which is demanding. Second, whether you can afford enough volume to learn, which is the 10 to 20 clicks a day floor above. Third, whether anyone answers the phone, because in lead generation the follow-up speed usually moves the final cost per customer more than any setting in the account does.
There is no free Google Ads tier, but there is a free way to estimate before committing. Google Keyword Planner returns bid ranges and search volumes for your own keywords without spending anything, and Google Analytics will tell you what the traffic does once it lands. Between them you can model what Google Ads will cost your business before you fund the account.
How much should you spend? Work backwards from margin, not from a benchmark
The budget question has a defensible answer, and it does not come from an industry average. It comes from what a customer is worth to you.
For a lead generation business, the chain is four multiplications deep:
- Clicks to leads. Your landing page conversion rate. The 2026 all-industry figure is 8.18%, and our article on lead conversion rate breaks down the stages behind it.
- Leads to qualified leads. Some proportion of forms are real buyers.
- Qualified leads to customers. Your sales close rate.
- Customer value. Gross profit per customer, not revenue.
Multiply the three rates and you get customers per click. Divide gross profit per customer by that figure and you have the most you can pay for a click and still break even, which is your break-even CPC. Anything below it is profit. This is the calculation our lead generation return on investment calculator runs, and it is the only way to know whether a $9.87 legal click is expensive or a bargain.
For an ecommerce business the chain is shorter and the same logic applies through break-even return on ad spend: your gross margin sets the return you must clear, and the ecommerce return on ad spend calculator converts that into a target. Both calculators sit on our resources hub alongside the rest of the profit metrics.
Two practical floors are worth stating, because "there is no minimum" is true and unhelpful.
A campaign needs enough daily budget to enter the auction more than a handful of times a day. If your category's click costs $8 and you budget $10 a day, you are buying roughly one click, and one click a day will never produce enough data for any bid strategy to learn from. As a working rule, a search campaign wants at least 10 to 20 clicks a day before its numbers mean anything, which in a $8 category is $80 to $160 a day rather than $10.
And you need enough conversions to judge the account. Thirty conversions a month is roughly the point where a change in cost per lead is a signal rather than noise. At an $66.69 cost per lead, that is about $2,000 a month. Below that, you are not running a campaign so much as sampling one.
How your Google Ads budget is actually spent
Knowing what a click costs is half the picture. The other half is how Google Ads determines which of your keywords cost you money on any given day, because that is what decides whether your spend produced anything.
A Google Ads campaign draws from a budget you set at campaign level. Within that, the keywords you choose determine which ads enter which auctions, and the Google Ads auction system decides, every time someone searches, which ads reach the page and in what order. You are billed only when someone clicks on your ad. An impression costs nothing, so your ads will still build visibility on searches that never convert into a click, and you pay nothing for it.
Where your Google Ads budget is spent is visible rather than a mystery. The campaign and keyword reports show cost, clicks and conversions per term, so within a fortnight you can see which handful of keywords is absorbing the spend. In most accounts we audit the answer is uncomfortable: a small number of broad terms take the majority of the budget and produce the smallest share of the revenue. Finding that is usually worth more than any bid adjustment.
Four factors that impact Google Ads costs, in the order they tend to matter:
- Which searches you are willing to pay for. Match types and negative keywords decide this, and it is the single biggest lever on the average cost of a conversion.
- How relevant your ads and pages are. Quality divides the price, so a better score can make your ads cheaper without touching a bid.
- How much competition wants the same click. Outside your control, but it is what you are measuring when you ask what Google advertising costs in your category.
- What you count as a conversion. Decides whether the reported average cost per acquisition means anything at all.
If you are new to Google Ads, the order above is also the order to work in. Most people start at number three, conclude that Google Ads pricing is too expensive for them, and never reach the first two, which are the ones that would have changed the answer.
Find your own number in 30 days
Every benchmark in this article is a substitute for a measurement you can take yourself, and yours will be better than any of them because it is about your keywords, your geography and your margin.
Week one. Fix what you are counting. Before spending on discovery, make sure a conversion in the account means a real sales opportunity. Remove micro-conversions from the column your bidding optimises toward. Half the accounts we audit are optimising toward something nobody in the business would call a lead.
Week one, in parallel. Get Google's own estimate for your keywords. Keyword Planner returns a top-of-page bid range for every keyword, low and high, from Google's own auction data. It is the closest thing to a rate card that exists, it is specific to your keywords and your location, and it is free. Compare the high end of that range to your break-even cost per click before you launch, not after.
Weeks two and three. Buy data deliberately. Run tightly matched keywords with clear commercial intent, at a daily budget that buys 10 to 20 clicks a day. Do not spread a small budget across broad match and the display network. You are paying for a measurement, so protect the measurement.
Week four. Compute four numbers. Your actual CPC. Clicks per conversion. Cost per conversion. And the proportion of conversions your sales team would call real. That last one converts a cost per lead into a cost per opportunity, which is the figure that decides whether to scale.
At the end of the month you have your own CPC, your own conversion rate and your own cost per acquisition, measured on your own account. Then the benchmark tables become what they should always have been: a sanity check, not a target.
Where this leaves your budget
Google Ads cost is not a price to look up. It is a ceiling you set, a Google Ads auction that decides the rest, and a margin that tells you whether the result was worth it.
Three things are worth carrying out of this article. The industry's most-repeated CPC was measured in 2017 and is roughly half the current figure, so stop quoting it. The best current dataset publishes medians while calling them averages, so compare like with like. And the two numbers Google actually guarantees, twice the daily budget in a day and 30.4 times it in a month, are more useful for planning than any average.
If you would rather not spend the first month of budget discovering all of this, that is the work we do. We manage your Google Ads from the margin backwards, and our Google Ads management service starts from your margin and works back to a CPC you can afford, whether that is high-ticket business services where one customer pays for a quarter of media, software and artificial intelligence companies with a long sales cycle, or home improvement where the click costs $8 and the lead has to be real. You can see how the arithmetic played out in our high-ticket business services case study and the home improvement case study.
If you have an account running now and want to know what your real cost per acquisition is, rather than what the reporting column says, request a free ad audit. We will read the account, check what it is counting as a conversion, and give you the number your margin can support.