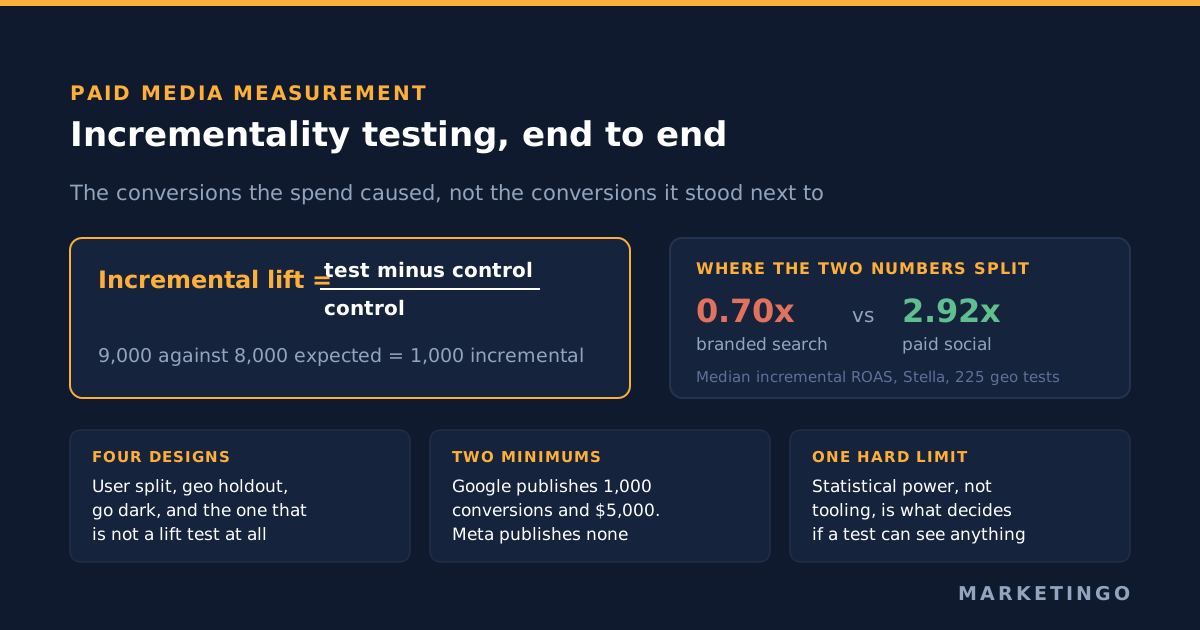
Incrementality testing withholds advertising from a randomly chosen control group, runs it as usual for a test group, and measures the difference in conversions between them. That difference is incremental lift: the conversions the spend caused rather than the conversions it was merely present for. Attribution counts the second number. Only an experiment produces the first.
What incrementality measures that attribution cannot
Every attribution model starts from the same raw material: conversions that happened, and the ads those converters touched. The model then decides how to divide the credit. Last click gives it all to the final touch, data-driven models spread it across the path, and the platform's own reporting counts a conversion when it can tie one to an impression or click inside its window. None of these methods can tell you which of those people would have converted anyway, because none of them observe a world where the ad did not run.
An incrementality experiment constructs that world on purpose. Randomise your audience into test and control groups, show ads to one and withhold them from the other, and the gap between the two is causal. It is the same logic a clinical trial uses, applied to marketing spend, and it is the only way a marketer can put a number on the causal impact of a channel rather than on its reported contribution.
The practical consequence is that attribution and incrementality disagree most where the ad is most likely to be reaching someone already on their way to you. Branded search and retargeting are the textbook cases: both are aimed squarely at people who have already shown intent, so both look magnificent in an attribution model and can look very ordinary in an experiment. Prospecting campaigns, which reach people with no prior relationship, often run the other way and are undervalued by platform reporting.
The formula, and the three numbers it produces
The arithmetic is simpler than the vocabulary around it suggests. With equal-sized groups:
Incremental conversions = conversions (test group) − conversions (control group)
Incremental lift % = (test − control) ÷ control × 100
Incremental return on ad spend = incremental revenue ÷ ad spend
When the groups are not equal, scale the control to the size of the test group before subtracting. A 90/10 holdout with 9,000 conversions in the test cell and 800 in the 10% control implies 8,000 expected conversions without ads, so 1,000 conversions are incremental, not 8,200.
That third number, incremental return on ad spend, is the one worth steering on, because it is the only version of ROAS that survives contact with a counterfactual. Our ROAS formula article covers the reported version and its denominators; the marketing efficiency ratio comparison covers the blended view. An incrementality result sits underneath both and tells you how much of either was real.
The four test designs you can actually run
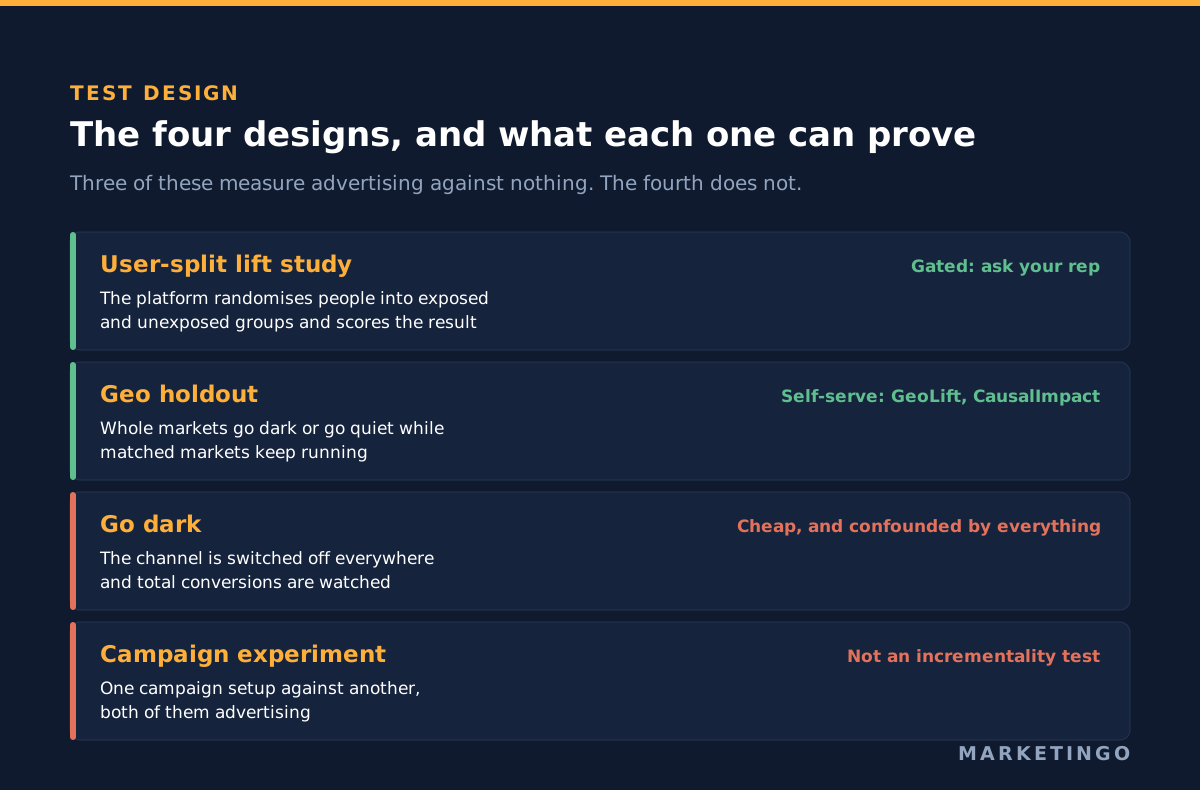
User-split lift studies. The ad platform randomises individual users into exposed and unexposed groups and reports the difference. Google calls it Conversion Lift based on users; Meta calls it Conversion Lift. Both are run by the platform, which means the platform both assigns the groups and scores the result, and both are access-gated rather than self-serve.
Geo holdout tests. Pick a set of markets, turn advertising off or down in some of them, keep it running in the rest, and compare. Geography replaces the individual as the unit of randomisation, which makes the test immune to cookie loss, app tracking changes and cross-device identity problems. Meta publishes GeoLift, an open-source R package that implements the synthetic control version of this. Google's own CausalImpact package does the Bayesian structural time series version. Google's Marketing Science team also published the underlying design in Measuring Ad Effectiveness Using Geo Experiments, which worked across 210 United States designated market areas, and a later time-based variant in Estimating Ad Effectiveness using Geo Experiments in a Time-Based Regression Framework for accounts with too few geographies for the original approach.
Go-dark tests. Switch a channel off completely for a period and watch what happens to total conversions. Crude, cheap, and the only option when you cannot split anything. It confounds the ad effect with everything else that moved during the window, so it is a last resort rather than a design.
Campaign experiments inside the ad platform. Google Ads experiments split traffic between a control campaign and a treatment campaign. These are A/B tests of settings, not incrementality tests: both arms are advertising, so the comparison is bid strategy against bid strategy, never advertising against nothing. They are useful and they are not the same instrument. The distinction trips up a lot of teams, and it is worth being clear internally about which question you are answering.
What the platforms publish, channel by channel
This is where most plans meet reality, because the documented minimums are higher than the budgets most advertisers assume.
Google. Conversion Lift exists in two forms, user-based and geography-based, and Google states it is not available for all accounts. For the user-based study, Google's own requirements page states you must have at least 1,000 observed conversions and a minimum campaign budget of $5,000, with a holdback anywhere from 1% to 50%, a floor of 7 days and 14 days recommended. The geography-based version requires that campaigns target a single country and currently supports holdback and go-dark studies only. Google is also moving the statistics: its documentation says it currently uses a frequentist method for most accounts and that 2025 brings a gradual transition to Bayesian reporting, under which studies below $5,000 of spend show no results at all and a minimum quality threshold of 150 conversions in treatment and 65 in control applies.
For ordinary campaign experiments rather than lift studies, Google recommends running at least 4 to 6 weeks and discards the first 7 days as ramp-up, then applies two-tailed significance testing at a 95% confidence interval.
Meta. Conversion Lift is run through the Marketing API as a study of type LIFT, Meta randomises accounts into test and control groups, and access is limited and arranged through a Meta representative. Meta publishes no minimum budget, duration or conversion volume for it anywhere in the public developer documentation; the numbers circulating in agency posts are not Meta's. The one public numeric threshold is that breakdown results display only when a breakdown combination carries at least 100 conversions across both groups. Meta's self-serve A/B tests are a different product, enforcing mutually exclusive audiences across 2 to 5 cells, and again they compare advertising with advertising.
GeoLift fills the gap for teams without rep access. Its walkthrough defaults to alpha of 0.1, a 90% confidence level, and advises that the test period contain at least one full purchase cycle. The documented worked example uses a 15-day campaign in two test markets against 90 days of history across 40 cities.
LinkedIn and Microsoft. This is the thin end. LinkedIn's public documentation covers A/B testing and brand lift testing, which measures survey-based attitudes rather than conversions, and caps tests at 90 days. Microsoft Advertising offers campaign experiments, with documentation that is sparse enough that a geo design run on your own data is usually the more dependable route. On both channels, if the question is incremental conversions rather than brand recall, plan on building the test yourself rather than requesting one.
The part nobody budgets for: can your test detect anything at all?

A test that cannot distinguish a 50% return from a zero return is not evidence, and most tests are that test. The definitive work here is Randall Lewis and Justin Rao's The Unfavorable Economics of Measuring the Returns to Advertising, published in the Quarterly Journal of Economics in 2015, which analysed 25 large field experiments with major United States retailers and brokerages covering $2.8 million of digital spend, every one of them with more than 500,000 unique users.
Their findings are blunt. The median confidence interval on return on investment across those campaigns was over 100 percentage points wide. A coefficient of variation of 10 in individual sales is common, which is why sales data drowns the ad effect. To separate a 50% return from a zero return, the median campaign in their sample would have needed to be nine times larger, and only 3 of the 25 had adequate power. To detect a 10% difference in return, the median campaign would need to be about 62 times larger. Their summary figure is that an informative experiment needs more than 10 million person-weeks.
That is the user-split world. Two things follow for anyone running a real account.
First, geo designs are usually the better instrument below enterprise scale, because a market is a much less noisy unit than a person. You are comparing aggregate sales curves between sets of cities rather than hunting for a signal inside individual purchase behaviour.
Second, run the power calculation before the test, not after. Decide the smallest lift that would change your decision, then work out the sample size that would detect it over the window you can afford. A sample size calculation done in advance is the difference between an experiment and an expensive anecdote. If the answer is no, you have learned something cheaply: that channel's budget decision has to be made another way, and your energy is better spent on the measurement that is available, such as holding spend flat and reading attribution model disagreement as a directional signal.
Reading the result without fooling yourself
Four habits separate a usable result from a number that gets quoted for a year and should not be.
Read the confidence interval, not the point estimate. A lift of 18% with an interval spanning −10% to +46% is not an 18% lift. It is a test that failed to rule out zero.
Decide the success threshold before you look. Most platform lift tools and most synthetic control implementations let you pick a confidence level, and picking it after seeing the data is how teams talk themselves into results. GeoLift's 90% default is a deliberate loosening for marketing decisions; whatever you choose, choose it first.
Include a post-treatment window where the purchase cycle demands it. Turning ads off for two weeks in a category with a six-week consideration cycle measures a delay, not an absence. This is a common defect: in one published analysis of branded search tests, only 27% included any post-treatment window at all.
Assume one test is about one period. Seasonality, competitive pressure and creative all move. Incrementality results from a slow month and a peak month can legitimately disagree, and the honest conclusion is that a channel's incremental impact varies with conditions, not that one of the two tests was wrong. Treat a single result as a reading of one season rather than a constant you can optimize against for a year.
What the published evidence actually shows
The useful surprise for anyone who has absorbed the "platforms inflate everything" version of this topic is that the largest published experiment set does not support it as a blanket claim.
Haus, which runs geo experiments commercially, published results from 640 Meta incrementality tests run since the start of 2024, across advertisers spending an average of $14 million a year on the channel. Its finding on 7-day click attribution is that for every $100 of platform-attributed direct-to-consumer revenue, Meta generated $115 of incremental revenue, which is under-reporting of roughly 15%. The same dataset found Meta drove a 19% average lift to primary business metrics and that Advantage+ campaigns over-reported relative to manual campaigns by 12 percentage points.
Where over-reporting is real and large is branded search and retargeting. Haus's analysis of branded search found that competitive context decides the answer: 82% of brands facing high competition on their own brand terms measured significant lift, against 35% of brands in low-competition conditions, with incrementality factors of 0.37 and 0.09 respectively. Measured published a case in which Google over-reported branded search by as much as 5x, and the detail that carries more weight than the multiplier is that with branded search switched off the retailer lost seven orders. Agency-side benchmarks point the same way: Stella's 2025 analysis of 225 geo tests reports a median incremental return on ad spend of 2.92x for Meta and 2.98x for Google Performance Max against 1.46x for non-branded search and 0.70x for branded search.
The pattern across all of it is consistent. Channels that create demand tend to be undervalued by attribution; channels that intercept demand already in motion tend to be overvalued. A marketer who moves budget on reported numbers alone will therefore tend to optimize toward the second group and starve the first, which is exactly the failure an experiment exists to catch.
The claim everyone repeats, and what the paper says
"eBay proved paid search doesn't work" is the most-cited result in this field and the most garbled. The paper is Consumer Heterogeneity and Paid Search Effectiveness by Blake, Nosko and Tadelis, published in Econometrica in 2015. Four corrections are worth making, because the retelling misleads in a direction that costs money.
It was not one experiment. The brand-keyword test and the non-brand test were separate, with separate designs. The famous return on investment of −63%, with a confidence interval running from −124% to −3%, comes from the non-brand geo experiment across 68 treated and 142 control designated market areas over 60 days.
The brand finding is a substitution result. When eBay stopped bidding on its own brand terms, 99.5% of the forgone click traffic was recovered through natural search. The conclusion the authors draw is that brand-keyword ads have no measurable short-term benefit for eBay, which is a statement about paying for traffic you already had.
The paper reports a positive effect, and the retelling drops it. Advertising significantly increased new registered users and purchases by infrequent buyers. Negative average returns arise because frequent buyers, who were coming anyway, consume most of the spend. About 42% of the lost paid clicks came from newly acquired users.
And the authors scope their own result. They write that their findings may not hold for "small and new entities that have no brand recognition," and that large firms with powerful brands will see little benefit. Most advertisers are not eBay. The lesson is to test your own brand terms, which is cheap, rather than to infer the answer from a 2015 experiment at one of the strongest brands on the internet.
For contrast on why observational methods are not a substitute, Gordon and colleagues compared 15 Facebook randomised trials with observational estimates across 500 million user-experiment observations. In half the studies the estimated percentage increase in purchases was off by a factor of three across all methods. In one study a naive exposed-versus-unexposed comparison reported a 316% lift where the trial measured 73%.
When not to run one
Incrementality testing is expensive in attention and in forgone spend, and it is the wrong tool more often than vendors admit.
Skip it when your conversion volume is too low for the test to resolve anything, which for most user-split designs means anything under Google's stated 1,000 observed conversions. Skip it when the channel is small enough that the whole budget is less than the cost of the uncertainty. Skip it when you already know what you would do with either answer, because a test that cannot change a decision is a report, not an experiment. And skip it during a period you cannot treat as normal: a product launch, a pricing change or a peak trading week will contaminate the comparison in ways no model repairs.
Marketing mix modeling, written MMM in most measurement documentation, is the usual alternative where experiments cannot reach, and the two are complements rather than rivals. An MMM gives you a continuous read across all marketing activities, including the offline ones no platform sees, and experiments are what calibrate it so that its coefficients mean something. An MMM on its own will happily attribute causal impact to whichever channel moved at the same time as sales; an experiment is what stops a marketer acting on that. Running an incrementality experiment to validate the model, then using the model between experiments, is the pattern most mature measurement setups converge on.
Where this fits in a paid media programme
The cheapest version of this work is not a formal study. It is knowing which parts of the account are intercepting demand and which are creating it, then testing the interception layer first, because that is where the gap between reported and incremental numbers is widest. Branded search, remarketing audiences and catalogue retargeting are the three places to start.
Waste tends to be visible before any experiment runs. In a roughly 40,000-product dental supplies catalogue we manage, 37% of the budget was going to products that had produced no revenue at all, and clearing that lifted blended Google return on ad spend from 7.86 to about 8.5 while spend was still scaling. No incrementality test was needed to find it, and finding it first makes any later test cleaner, because you are measuring the lift of advertising that was worth running.
For ecommerce accounts, work out your break-even number before you decide whether an incremental return is good: the ecommerce ROAS calculator gives you the threshold your margin sets, and the break-even ROAS article explains the arithmetic. For DTC ecommerce brands, an incremental return of 2.3x against a break-even of 2.8x is a loss wearing a respectable-looking number.
Most of this is ordinary campaign management rather than measurement science: clean conversion tracking, honest counting, and Google Ads and Meta accounts structured so that prospecting and retargeting can be read separately in the first place. If you want a second pair of eyes on which parts of your account are paying to reach people who were already coming, a free ad audit will tell you where to look before you spend anything on a test.