The CAC payback period measures how long it takes to earn back the cost of acquiring a customer. It is the number of months of gross profit needed to repay what you spent winning them.
CAC payback period = customer acquisition cost ÷ (monthly recurring revenue per new customer × gross margin)
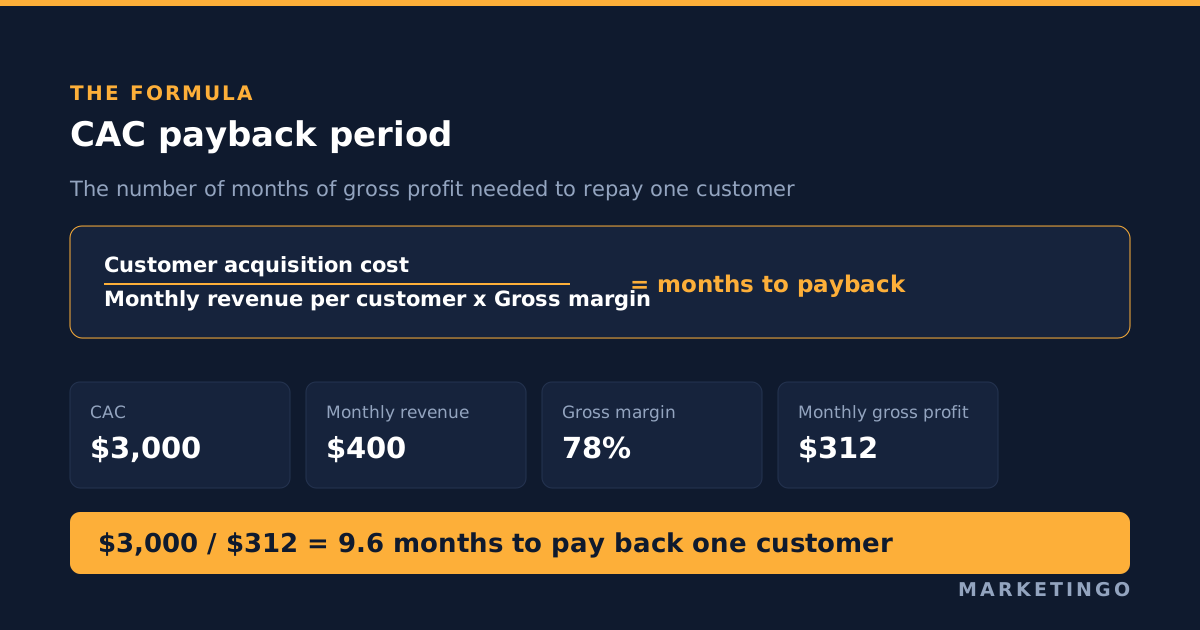
A customer acquired for $3,000 who pays $400 a month at a 78% gross margin returns $312 a month, so the payback period is 9.6 months. That is the whole calculation, and the gross margin term is the part most companies leave out.
Payback is the metric worth arguing about, because it is the one that decides how fast you are allowed to spend. The LTV to CAC ratio tells you whether a customer is eventually worth more than they cost. Payback period tells you when the cash comes back, and cash is what you buy next month's clicks with. Two companies can both run a healthy 4:1 ratio while only one of them can afford to double its budget.
This article covers the formula the benchmark reports actually use, what the current medians are by company size, what the famous 12-month rule says in the source it came from, how to reduce a CAC payback period that is too long, and how to turn a payback target into a cost per lead you can bid against.
Most of the published benchmarks come from software as a service companies, usually shortened to SaaS, because subscription billing makes the payback arithmetic easy to see. The metric works the same way for any business with repeat revenue, and the final section covers the ecommerce version.
Why the CAC payback period is important
Three things make this the metric a SaaS business should put at the top of the dashboard.
It is a cash flow measure, and cash is the real constraint. Every other acquisition metric describes profit. The CAC payback period describes timing. A startup with twelve months of runway and an eighteen-month payback period is insolvent on paper even while every customer it acquires is profitable, because the money comes back after the company needs it.
It exposes risk that the LTV to CAC ratio hides. Lifetime value is a forecast built on an assumed churn rate. The payback period is almost entirely made of things that have already happened: spend you have booked and revenue you have billed. A longer payback period means more of your return depends on customers staying, so the further out the payback, the more of your business case rests on the churn rate being right.
It treats acquisition spend as what it really is. A SaaS CFO will recognise the shape of this calculation, because it is the payback period from capital budgeting applied to a marketing investment. You spend cash now to buy a stream of gross profit later, which makes every customer acquired a small piece of self-issued debt that repays itself over the payback window. The longer the window, the more the time value of money works against you, and the more of your working capital is committed before any of it comes back.
It is the number investors test first. Payback is harder to flatter than lifetime value, which is why it is the figure that appears in every benchmark survey and in most diligence questions. A company that can state its payback period, and the formula behind it, is already ahead of most of its peers.
The churn connection deserves one more line, because it is where the metric bites. If your monthly customer churn rate is 3%, the average customer lifetime is about 33 months. A 20-month payback period leaves only 13 months of gross profit as actual return, and the business is working but barely. The same payback period against a 1.5% churn rate leaves 47 months of return. Identical acquisition cost, completely different business.
The CAC payback period formula
There are two versions in circulation and they do not give the same answer.
The gross-margin-adjusted version is the one the published benchmarks use. Benchmarkit, which runs the annual B2B software performance survey with Pavilion, defines payback as how many months it takes to repay the sales and marketing expense for new customers "on a Gross Margin adjusted basis", and states the calculation as sales and marketing expenses divided by new customer annual recurring revenue multiplied by gross subscription margin, times twelve.
Per customer, that reduces to the formula at the top of this article.
| Input | Value |
|---|---|
| Sales and marketing spend, one month | $60,000 |
| New customers acquired from it | 20 |
| Customer acquisition cost | $3,000 |
| Monthly recurring revenue per new customer, also called average revenue per account | $400 |
| Gross margin | 78% |
| Monthly gross profit per new customer | $312 |
| CAC payback period | 9.6 months |
The second version divides acquisition cost by monthly recurring revenue, usually shortened to MRR, and skips the margin. On the same account it returns 7.5 months.
Neither number is wrong arithmetic. They answer different questions. The revenue version asks when the customer has paid you back the cash. The gross profit version asks when the customer has paid you back the cash you get to keep after serving them, which is the money available to buy the next customer. Only the second one tells you anything about whether you can scale.
Two details decide whether your own figure is honest.
The first is scope. The cost of acquiring new customers has to carry the full sales and marketing expense, including salaries, commissions, tooling and agency fees, not only the media bill. Divide the CAC that comes out of that total, not the one that comes out of the advertising invoice.
The second is period matching. The customers acquired over a specific period have to be the ones that period's spend actually bought, which is where most calculations quietly break: a 90-day sales cycle means this month's new customers were paid for with spend from two or three months ago. Dividing this month's spend by this month's signups during a growth phase understates CAC and therefore understates payback time. We cover both traps in detail in the article on customer acquisition cost.
CAC payback period benchmarks for 2026
The most useful current dataset is High Alpha's 2025 benchmarks survey, which collected responses from more than 800 software companies with data as of the second quarter of 2025. It reports median payback by annual recurring revenue band, and the shape of the result is the interesting part.
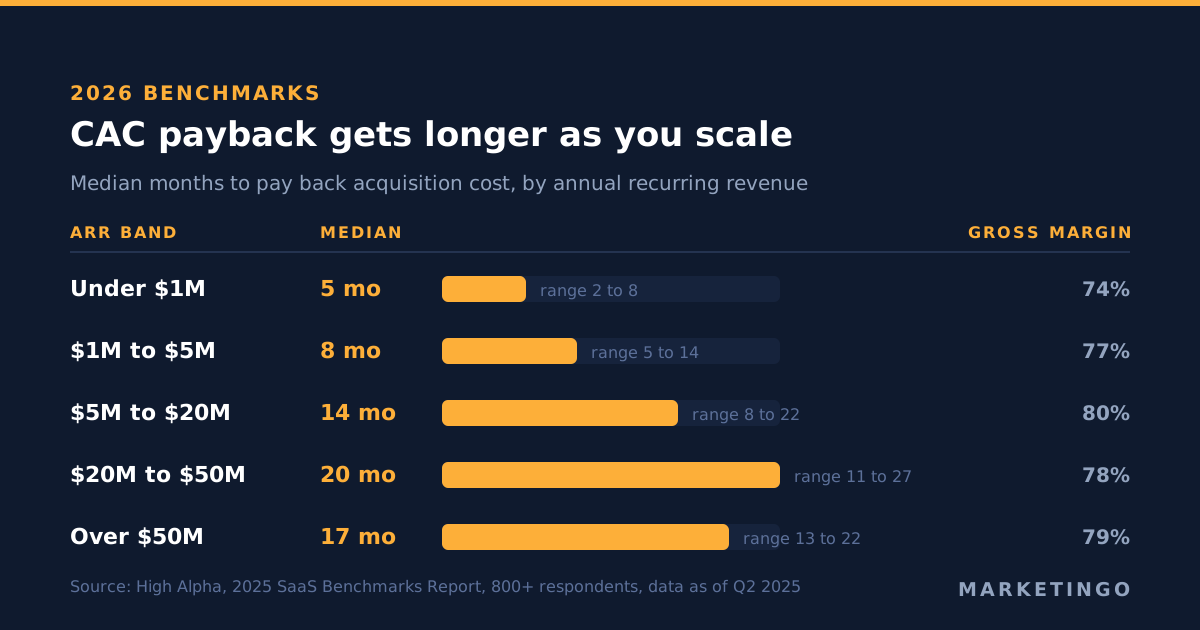
| Annual recurring revenue | Median CAC payback | Middle range | Median gross margin |
|---|---|---|---|
| Under $1 million | 5 months | 2 to 8 | 74% |
| $1 million to $5 million | 8 months | 5 to 14 | 77% |
| $5 million to $20 million | 14 months | 8 to 22 | 80% |
| $20 million to $50 million | 20 months | 11 to 27 | 78% |
| Over $50 million | 17 months | 13 to 22 | 79% |
Source: High Alpha, 2025 SaaS Benchmarks Report, data as of Q2 2025, 800+ respondents.
Payback gets longer as companies get bigger, up to around $50 million in annual recurring revenue. That runs against the instinct that efficiency improves with scale. It happens because the cheap demand goes first. The earliest customers arrive through founder networks, a narrow set of high-intent keywords and word of mouth, all of which are close to free. Growth past that point means buying audiences who were not already looking, and those cost more per customer in every channel.
Two figures from the Benchmarkit and Pavilion survey of 148 companies fill in the picture. The blended acquisition cost ratio, total sales and marketing spend per dollar of new plus expansion recurring revenue, sits at a median of $0.81. The new customer ratio, which strips expansion out, sits at $2.00 and rose 14% year over year. Expansion revenue from existing customers is where the efficiency is, and new logo acquisition costs roughly two and a half times as much per dollar. Benchmarkit also reports that median payback has lengthened 12.5% since 2022.
The 12-month rule says the opposite of what people repeat
"Keep CAC payback under 12 months" is the most repeated benchmark in software, and almost nobody who repeats it has read where it came from.
It traces to the SaaS metrics work published on forentrepreneurs.com by David Skok, which is the origin of months-to-recover-CAC as a tracked metric. That source gives two numbers. It says "many of the best SaaS businesses are able to recover their CAC in 5-7 months". And it says profitability becomes anemic once the time to recover acquisition cost extends beyond 12 months.
So 12 months was never the target. It was the line past which the business model starts to struggle. The target was 5 to 7 months. A company celebrating an 11-month payback is congratulating itself for sitting just inside the failure boundary.
Read against the data, the rule has a second problem: it is blind to size. On the High Alpha medians, a company under $5 million in annual recurring revenue that posts 12 months is performing below the median for its band. A company between $20 million and $50 million that posts 12 months is in the top quartile. The same number is a warning in one case and an achievement in the other, and a single universal threshold cannot carry both.
The original source anticipated this, incidentally, and the anticipation also gets dropped. It notes that large businesses with access to cheap capital can afford a longer time to recover acquisition cost, while startups usually find capital expensive. Payback tolerance is a function of your balance sheet, not a property of your industry.
What to do with the rule: use your own revenue band's median as the comparison, treat 12 months or less as the minimum bar rather than the goal, use 5 to 7 months as the standard for a SaaS business that wants to grow without raising money, and treat anything past 18 months as a financing decision rather than a marketing one.
The same account, two formulas, three months apart
Because the margin term is optional in practice and mandatory in the benchmark definitions, the gap between the two formulas is systematic rather than random. The revenue version always returns a shorter payback, and it is always shorter by exactly one minus your gross margin.
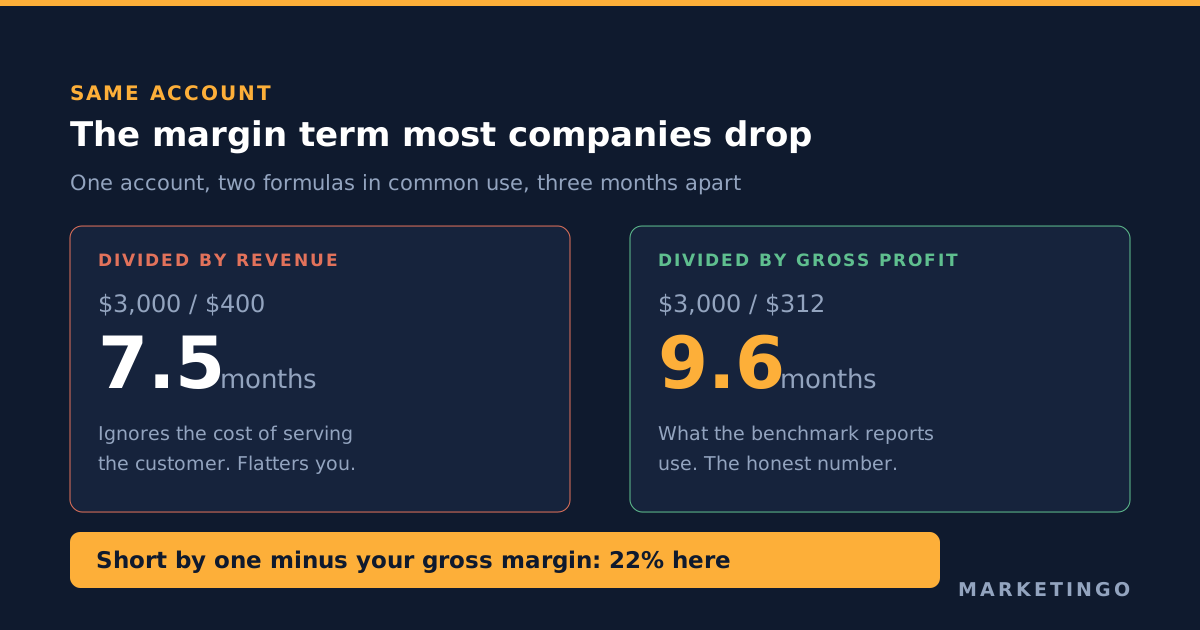
At a 78% gross margin the revenue version understates payback by 22%. At the 74% median gross margin High Alpha records for companies under $1 million in annual recurring revenue, it understates by 26%.
That is enough to move a company across the line it is being judged against. A reported 9-month payback computed on revenue is an 11.5-month payback computed on gross profit. The first clears the famous threshold and the second does not, from identical accounts.
Three practical consequences. When you compare your number to a published benchmark, check which formula the benchmark used, because the gross-margin-adjusted version is the one in the survey reports. When an investor or board asks for payback, state the formula alongside the number. And when you are using payback internally to decide what you can spend, always use the gross profit version, because that is the only one made of money you can actually redeploy.
Why payback, not the LTV to CAC ratio, limits your ad budget
This is where the metric earns its place in a paid media conversation rather than a finance one.
The LTV to CAC ratio is a profitability statement. It says a customer will eventually be worth some multiple of what they cost to acquire. Payback period is a cash flow statement. It says when the money comes back and is available to spend again.
Advertising is bought with cash, in advance, every month. So the constraint on how much media you can run is not whether acquiring new customers is profitable, it is how much cash you can have unrecovered at any one time. This is the sense in which the CAC payback period affects every budget conversation you will have.
Take a company that is willing to have $300,000 of working capital out in customer acquisition and not yet repaid. Assume repayment arrives evenly across the payback window, so the average cohort of spend is about half repaid at any moment. The outstanding amount is then roughly the monthly spend multiplied by half the payback period, which gives a sustainable monthly budget of twice the available capital divided by the payback months.
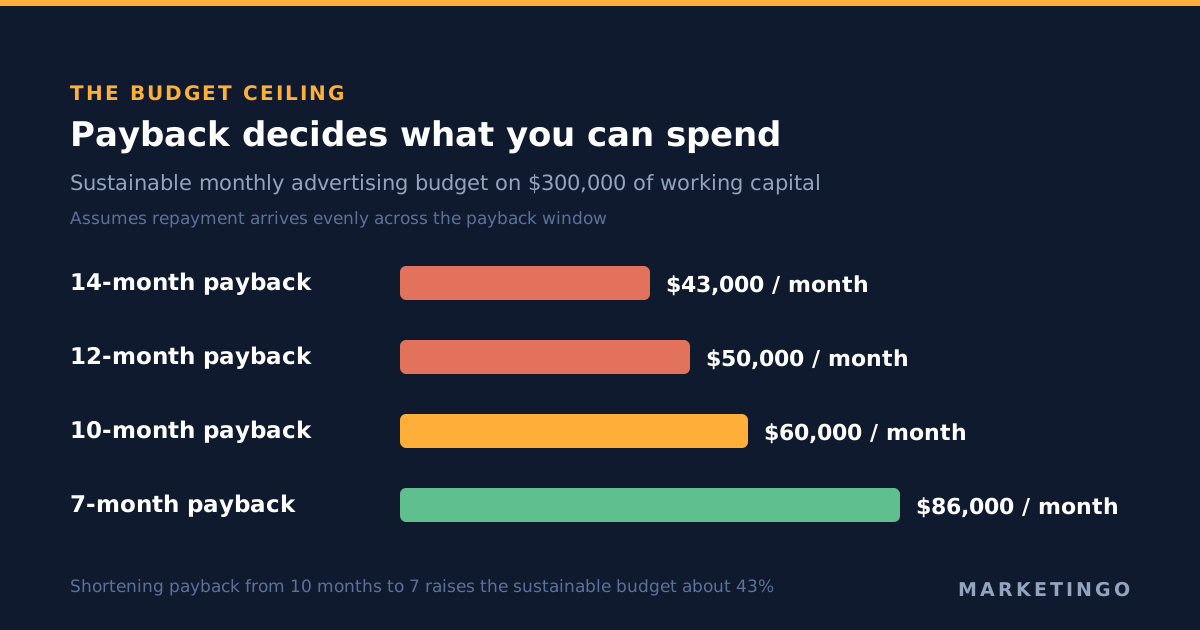
| Payback period | Sustainable monthly ad budget on $300,000 |
|---|---|
| 14 months | about $43,000 |
| 12 months | $50,000 |
| 10 months | $60,000 |
| 7 months | about $86,000 |
Shortening payback from 10 months to 7 raises the sustainable budget by roughly 43%, with no change in the LTV to CAC ratio and no additional funding. That is the argument for treating payback as the headline number: it converts directly into available media spend, and the ratio does not.
It also explains a pattern we see in audits. An account that looks fine on every efficiency metric stalls at a budget ceiling nobody can explain, and the cause is a payback period long enough that the finance team has quietly stopped approving increases.
Working back from a payback target to a cost per lead you can bid
A payback target is only useful once it becomes a number your bidding can respect. The chain is four steps and it runs backwards from the month.
One. Monthly gross profit per customer. Recurring revenue per customer multiplied by gross margin. In the worked example, $400 at 78% is $312.
Two. Maximum allowable acquisition cost. Target payback months multiplied by monthly gross profit. A 9-month target gives $2,808.
Three. Maximum allowable cost per lead. Allowable acquisition cost multiplied by your lead to customer rate. At 12%, that is $337. If you do not know your lead to customer rate to within a couple of points, that is the measurement to fix before any of this is actionable, and the stage conversion rates in the piece on lead conversion rate are a reasonable starting frame.
Four. Compare it to what you are paying. If your blended cost per lead is $420 rather than $337, your implied acquisition cost is $3,500 and your actual payback is 11.2 months, not 9. The gap is not a rounding issue, it is three months of cash.
Our lead generation return on investment calculator runs this chain with your own numbers, and the article on what a good cost per lead looks like covers the benchmarks for step four.
The reason to do the arithmetic in this direction is that it produces a ceiling rather than an opinion. A target cost per acquisition set from a payback target is defensible to a finance team in a way that a target copied from an industry average never is.
How to reduce your CAC payback period
A long CAC payback period has four possible causes, and only some of them are a marketing problem. These are the key inputs, in the order of how fast each one moves.
Reduce the CAC. The input everyone reaches for first, and the one paid media controls most directly. A lower CAC shortens payback proportionally: cut acquisition cost by a third and a 12-month payback becomes 8 months. The usual causes of an inflated figure are spend on search terms with no commercial intent, bidding optimised toward a conversion action that is not a real sales opportunity, and budget sitting in campaigns running at several times the account's own cost per lead. For a regulatory compliance client we cut cost per lead 64%, from $112 to $40.25, while adding 557 additional high-value leads over six months, which is set out in the high-ticket business services case study. A 64% reduction in acquisition cost divides the payback period by nearly three.
Price. Payback is linear in revenue per customer, so a 15% price increase shortens payback by 13%. This is usually the fastest available lever and the one least often pulled.
Gross margin. Hosting, support and onboarding costs all sit here. Margin improvements are slow but they compound into every cohort.
Time to first revenue. Annual contracts paid up front collapse payback to a fraction of the monthly equivalent. A company with a 12-month payback on monthly billing and a 20% annual prepay rate has a materially shorter blended payback, and that is a pricing page change rather than a campaign change.
Two of these four are outside an advertising account. It is worth saying plainly, because a longer CAC payback period is often handed to the media team as a performance problem when the arithmetic says the problem is a $39 monthly price point.
One input that is not on the list: churn. Improving retention does not shorten the CAC payback period at all, because payback is measured on the revenue of customers who are still present during the window. Lower churn raises customer lifetime value and the LTV to CAC ratio while leaving payback untouched, which is one of the clearest reasons to track both numbers rather than treating either as a summary of the other.
When a long payback period is fine
A longer CAC payback period does not always need fixing.
It is fine when net revenue retention is above 100%, because revenue per customer grows after acquisition and the payback calculated on month-one revenue overstates the real recovery time. Benchmarkit's median net revenue retention is 101%, so this applies to roughly half of companies, though not dramatically.
It is fine when the capital is genuinely cheap and the customers genuinely stay, which is the condition the original source named for large businesses with access to inexpensive funding.
It is fine when you are deliberately buying market position in a window that will close, as long as somebody has decided that on purpose and written down when the window shuts.
It is not fine when payback is longer than the average customer lifetime, which means the cohort never repays at all. It is not fine when it is lengthening while growth is flat, the combination the Benchmarkit trend points at. And it is not fine when nobody in the company can state the number, which is the most common case we meet.
CAC payback period for ecommerce, where months are the wrong unit
For a direct-to-consumer brand, months are a poor unit because purchases are not scheduled. Payback is better expressed in orders.
Payback in orders = customer acquisition cost ÷ contribution margin per order
A brand with an average order value of $72 and a 42% contribution margin after cost of goods, shipping and payment fees earns $30.24 per order. At a $54 acquisition cost, payback is 1.79 orders. The first order recovers just over half the acquisition cost, and the brand gets paid on the second one.
That single number reframes the whole account. It means the repeat purchase rate inside the first 90 days, not the return on ad spend of the acquisition campaign, decides whether the company makes money. It also means a first-order break-even return on ad spend of 2.38 is the honest target for prospecting, and anything above that is profit on order one rather than a requirement. The ecommerce return on ad spend calculator will run the margin side of this with your figures.
Where to take this next
Three things are worth carrying out of this article. Calculate payback on gross profit, not revenue, because the revenue version understates it by exactly your cost of goods and the published benchmarks all use the margin-adjusted definition. Compare yourself to your own revenue band rather than to the 12-month rule, which the original source published as the point where profitability goes anemic and not as a pass mark. And use payback rather than the LTV to CAC ratio when you are deciding what to spend, because payback converts into a monthly media budget and the ratio does not.
The work of getting acquisition cost down is specific and it happens in the account. We run Google Ads management and LinkedIn Ads from the margin backwards, setting the allowable cost per lead from the client's own contract values before touching a bid, whether that is software and artificial intelligence companies with a long sales cycle or high-ticket business services where one customer pays for a quarter of media. The artificial intelligence compliance case study shows what that looks like from a standing start.
If you have an account running now and want to know what your real acquisition cost and payback period are, rather than what the platform reporting column says, request a free ad audit. We will read the account, check what it is counting as a conversion, and give you the allowable cost per lead your margin and your payback target can support.