Customer lifetime value, usually shortened to CLV, is the total profit a single customer produces over the whole relationship, expressed in today's money. The working formula is a margin multiplied by a retention multiple:
Customer lifetime value = annual gross profit per customer × (retention rate ÷ (1 + discount rate − retention rate))
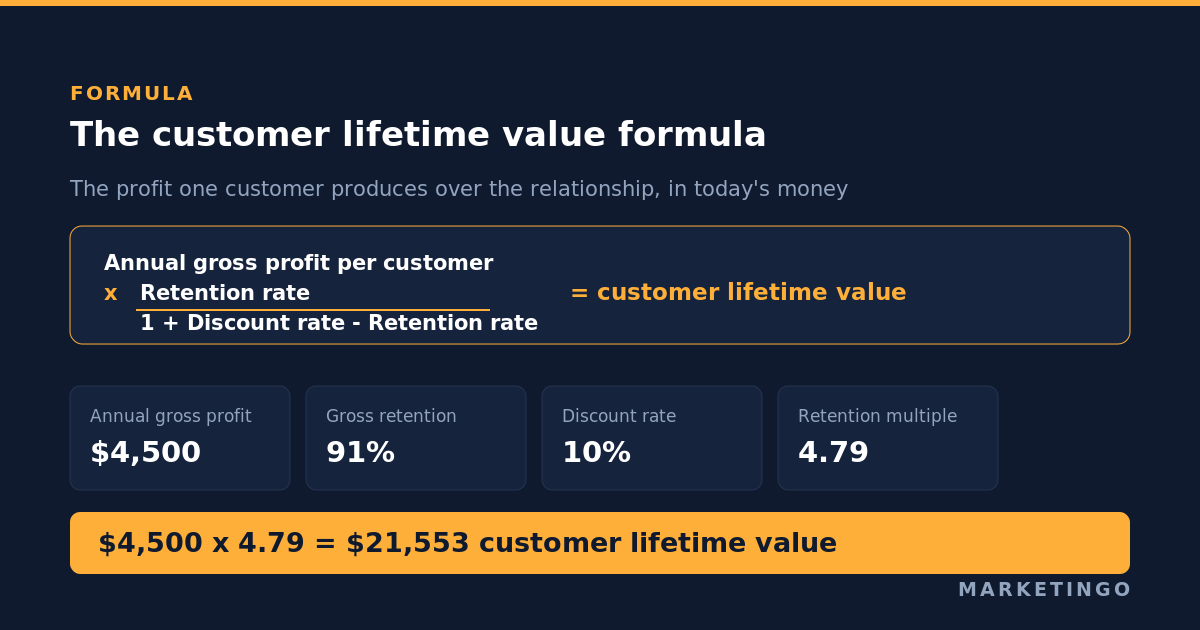
A customer paying $6,000 a year at a 75% gross margin produces $4,500 of annual gross profit. At a 91% annual retention rate and a 10% discount rate the retention multiple is 4.79, so the CLV is $21,553. That is the number you can set an acquisition budget against.
Run the same customer through the formula most published guides give, which is average purchase value multiplied by purchase frequency multiplied by customer lifespan, and you get $66,600. Both numbers describe the same customer. One of them is roughly three times the other, and the larger one is the one being quoted in budget meetings.
This article covers what each variable in the formula means, the three methods for calculating customer lifetime value and when each is appropriate, why the popular formula overstates the answer, what the current retention benchmarks are and what they do to the result, and how to work from a customer lifetime value to a cost per lead you can actually bid on in an ad auction.
Why CLV is the number that sets your ad budget
Every paid media decision is a bet on a future cash flow. You spend a known amount today to acquire a customer who pays you back over an unknown period. CLV is the estimate of that payback, and everything downstream depends on it.
It sets the ceiling on customer acquisition cost. The ratio of lifetime value to acquisition cost is the standard test of whether growth is affordable. Whatever target ratio you use, the allowable acquisition cost is the lifetime value divided by that target. Get the lifetime value wrong by a factor of three and you authorise an acquisition cost three times too high, which looks like aggressive growth for two quarters and like a cash problem in the third.
It decides which customers to bid for, not just how much. A single blended CLV across the whole customer base is nearly useless for media buying. Calculated per segment, it tells you which audiences, products and geographies deserve a higher bid. A segment with twice the lifetime value can carry twice the cost per acquisition at the same return.
It is the only metric that values retention in advertising terms. Conversion rate, cost per click and cost per lead all stop at the first purchase. CLV is where product quality, onboarding and churn arrive in the media plan, because they move the retention rate, and the retention rate is the variable the formula is most sensitive to.
It is the input nobody audits. Acquisition cost gets argued over line by line. Lifetime value is usually a figure somebody calculated once, in a spreadsheet nobody has opened since, using a formula from a blog post. That is the asymmetry this article is about.
The three methods for calculating CLV
There are three legitimate approaches. They answer different questions and they produce different numbers from the same data, which is why the method should be stated whenever the figure is quoted.
Historic CLV adds up the gross profit a customer has already produced. No forecasting, no assumptions, just the transaction history multiplied by margin. This is the method to use when you are segmenting an existing customer base, because it is the only one that is a measurement rather than an estimate. Its limit is obvious: it says nothing about customers who are still in the relationship, and it systematically understates the value of recent cohorts who have not had time to buy again.
Churn-based CLV, also called the margin multiple method, is the formula at the top of this article. It takes the margin per period, assumes a constant retention rate, and discounts the resulting stream. This is the method for setting acquisition budgets, because it produces a forward-looking number from two inputs you can measure and one you choose. It assumes retention is constant across the customer lifespan, which it is not: the first period always churns hardest. That assumption makes it mildly conservative for cohorts that survive their first year, and optimistic for brand new ones.
Predictive CLV fits a statistical model to historical transaction behaviour and forecasts individual customers forward. Done well it is the most accurate of the three and it is the only one that can separate a customer who has quietly stopped buying from one who buys twice a year. It needs a few years of clean transaction data, it needs rebuilding as the business changes, and in a paid media context its output is usually a segment score to bid against rather than a dollar figure to budget from.
A fourth approach, cohort analysis, is better thought of as the way you check the other three. Group customers by the month they were acquired, track cumulative gross profit per customer for each group, and the curves tell you whether your assumed retention rate and your assumed lifespan survive contact with the actual data. If the cohort curves flatten at a cumulative gross profit well below your churn-based estimate, the estimate is wrong and the cohorts are right.
How to calculate CLV step by step
The churn-based method takes four inputs and about ten minutes, and the discipline is in defining each one before you reach for a calculator.
Step one, average revenue per customer per period. Take the revenue from a cohort over a full period and divide by the number of customers in it. Use a year for subscription businesses and a fixed window for everything else. This is what a typical customer spends with you in that period, not what your best accounts spend.
Step two, gross margin. Subtract the cost of serving the customer: hosting and support for software, cost of goods and shipping for physical products. Multiply the revenue figure by the resulting margin. The output is the annual gross profit a customer brings, which is the only money available to repay acquisition.
Step three, the customer retention rate. Count how many customers who were active at the start of the period are still active at the end, and ignore expansion revenue from the ones who stayed. The reciprocal of one minus that rate is the average customer lifespan implied by your own data, which is usually longer than anyone expects and is the number worth sanity-checking against cohort curves.
Step four, the discount rate. Pick your cost of capital and write it down beside the result.
The CLV formula then assembles them: annual gross profit multiplied by the retention rate, divided by one plus the discount rate minus the retention rate. Calculate CLV this way and the output is the monetary value of a customer over the entire relationship, stated in today's money, which is the figure a budget can be built on. Historic CLV is the same arithmetic run backwards: instead of estimating customer lifetime value forward, add up what an existing customer has already spent and multiply by margin. Run both. If the historic figure for a mature cohort sits far below the churn-based estimate, the retention rate is the input to re-examine.
A CLV model is only as good as the period you measure it over. Recalculate as cohorts mature rather than tracking CLV as though it were a live dashboard number, because the metric moves slowly and reacts to changes in the business a year after they happen.
The formula on page one of Google is lifetime revenue, not lifetime value
Here is the claim worth interrogating, because it is repeated by sources that have every reason to get it right.
The two highest-scoring pages ranking for this term publish revenue-based formulas with no margin term and no discount rate, while describing the metric in the language of profit.
HubSpot publishes "Customer Lifetime Value = Customer Value x Average Customer Lifespan", where customer value is average purchase value multiplied by average number of purchases. The page describes the metric as the total revenue a business can expect from a customer. Gross margin does not appear in the formula, and the page does not mention discounting future cash flows at all.
Stripe publishes two: "CLV = (Average Value of a Transaction) x (Average Number of Transactions) x (Customer Lifespan)" and a retention-weighted variant. The page states that customer lifetime value "is most accurate when it accounts for the costs of goods sold", and lists gross margin among metrics businesses add, without showing where either goes in the arithmetic. There is no discount rate.
Neither page is wrong about what it is computing. Both are computing lifetime revenue and labelling it lifetime value. The gap between those two quantities is not a rounding error, and it runs in one direction.
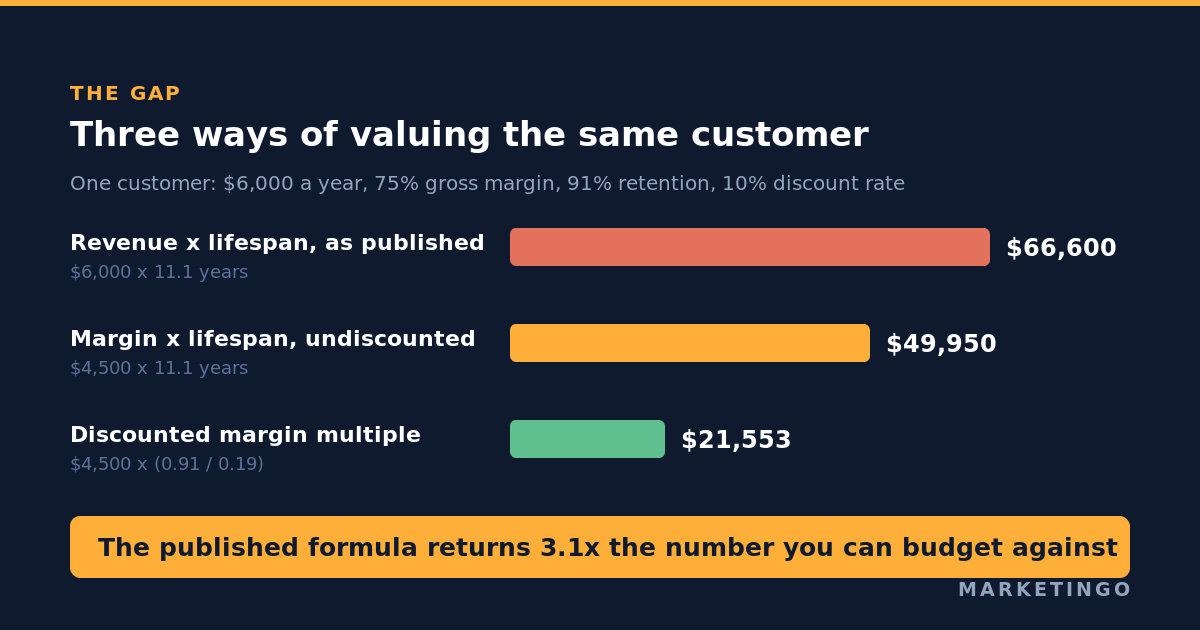
Take the customer from the opening: $6,000 a year, 75% gross margin, 91% annual retention, 10% discount rate.
| Method | Arithmetic | Result |
|---|---|---|
| Revenue × lifespan, as published | $6,000 × 11.1 years | $66,600 |
| Margin × lifespan, undiscounted | $4,500 × 11.1 years | $49,950 |
| Discounted margin multiple | $4,500 × (0.91 ÷ 0.19) | $21,553 |
The published formula returns 3.1 times the usable figure. Two separate errors stack. Leaving out gross margin inflates the answer by one divided by the margin, so 1.33 times at a 75% margin. Leaving out the discount rate inflates it again, because a dollar of gross profit arriving in year nine is not worth a dollar today, and at 91% retention a large share of the total sits years out.
The reason this matters for advertising rather than for accounting is that the inflated number is the one that gets divided by a target ratio to produce an acquisition budget. At a 3:1 target, $66,600 authorises $22,200 per customer. The honest figure authorises $7,184. Those are different businesses.
Retention benchmarks, and what they do to the number
The retention rate does more work in this formula than any other input, so it is worth anchoring to published data rather than to a guess.
SaaS Capital surveyed more than 1,000 private business-to-business software companies in the first quarter of 2025 for the fourteenth edition of its retention benchmarks, and reports a 2025 median net revenue retention of 101% and a median gross revenue retention of 91%. Broken down by annual contract value, the medians are:
| Annual contract value | Median gross revenue retention | Median net revenue retention |
|---|---|---|
| Under $12,000 | 90% | 98% |
| $12,000 to $25,000 | 91% | 103% |
| $25,000 to $50,000 | 91% | 102% |
| $50,000 to $100,000 | 90% | 104% |
| $100,000 to $250,000 | 91% | 102% |
| Over $250,000 | 95% | 106% |
Source: SaaS Capital, 2025 B2B SaaS Retention Benchmarks, survey conducted in the first quarter of 2025, companies under $1 million in annual recurring revenue excluded from the breakdown.
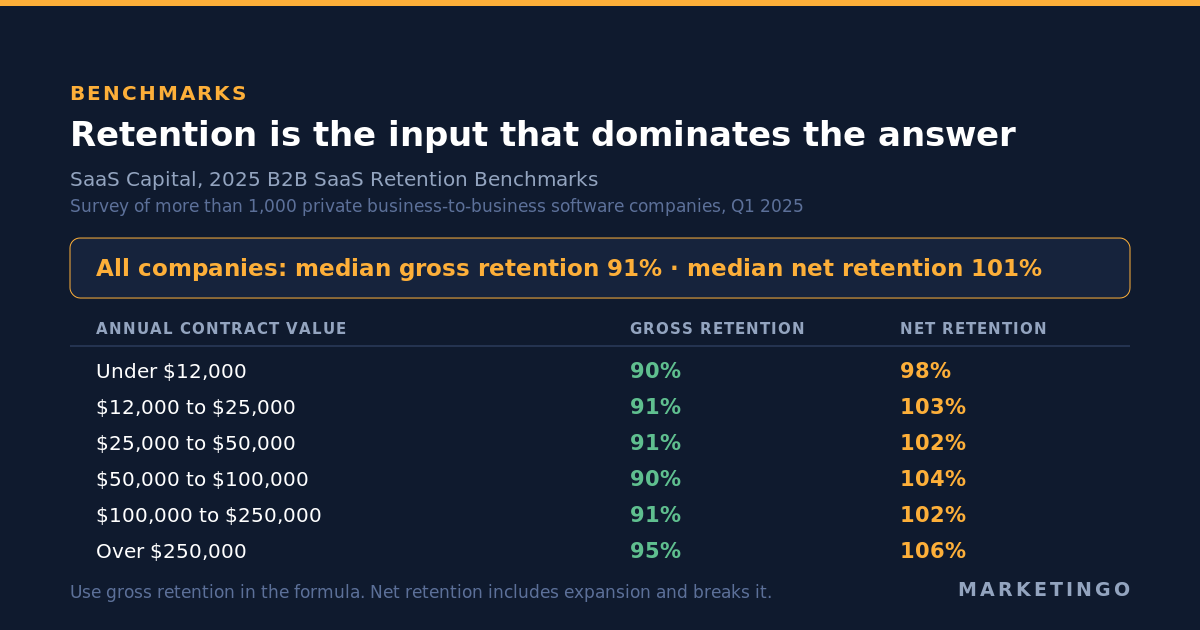
Two things follow from that table, and both change the lifetime value calculation.
One percentage point of retention is worth far more at the top of the range than at the bottom. The retention multiple is not linear. Holding margin at $4,500 and the discount rate at 10%, moving from 85% to 90% retention adds about $5,000 of lifetime value. Moving from 90% to 95% adds about $8,250. Moving from 95% to 98% adds another $8,250 from a three point improvement rather than a five point one. Above 95% the curve steepens sharply, which is why the companies with the highest contract values and the best retention can outbid everyone else for the same customer and still hit their ratio.
| Annual gross retention | Retention multiple at a 10% discount rate | Lifetime value on $4,500 of annual gross profit |
|---|---|---|
| 85% | 3.40 | $15,300 |
| 90% | 4.50 | $20,250 |
| 91% (2025 median) | 4.79 | $21,553 |
| 95% | 6.33 | $28,500 |
| 98% | 8.17 | $36,750 |
Net revenue retention breaks the formula, and the failure is silent. Gross revenue retention measures the revenue you keep from customers who stay. Net revenue retention adds expansion from those customers, which is why the medians above run 10 points higher. Substituting net retention into the churn-based formula looks reasonable and is not. At a net revenue retention of 101% and a 10% discount rate the multiple becomes 1.01 divided by 0.09, or 11.2, which more than doubles the answer. Worse, when net revenue retention reaches 110% and the discount rate is 10%, the denominator is exactly zero and the formula returns an infinite lifetime value. Companies above $250,000 in annual contract value already sit at a 106% median, so the top quartile is inside the range where this arithmetic stops working.
The rule is simple. Use gross retention in the churn-based formula, and treat expansion revenue as a separate line rather than as a higher retention rate. If expansion is a material part of your business, the honest approach is a cohort model, not a bigger multiple.
Pick the discount rate on purpose
The discount rate is the input people skip because it feels arbitrary. It is not arbitrary, it is a choice, and the choice should be your cost of capital: the return your business could get on that money elsewhere, or what it actually costs you to fund the spend. A profitable business funding growth from cash flow and a venture-backed company burning capital are not entitled to the same number.
What matters more than picking exactly right is picking deliberately and showing the sensitivity. On the same $4,500 of annual gross profit at 91% retention:
| Discount rate | Retention multiple | Customer lifetime value |
|---|---|---|
| 0% | 10.11 | $45,500 |
| 8% | 5.35 | $24,088 |
| 10% | 4.79 | $21,553 |
| 15% | 3.79 | $17,063 |
| 20% | 3.14 | $14,121 |
Moving from zero to 20% cuts the answer by more than two thirds. Any CLV figure quoted without its discount rate is incomplete, and a figure calculated at zero is the revenue-style number in a different costume.
From CLV to a cost per lead you can bid
This is the step that turns the metric into something a media buyer can act on, and it is four pieces of arithmetic.
Start with the lifetime value, $21,553 on the honest calculation. Divide by your target ratio of lifetime value to acquisition cost. At 3:1 that gives an allowable customer acquisition cost of $7,184. For why 3:1 is a convention rather than a law, and when it misleads, see the LTV to CAC ratio breakdown; for what belongs inside the acquisition cost itself, the customer acquisition cost formula is the reference.
Multiply the allowable acquisition cost by your close rate from qualified lead to customer. At 20%, five qualified leads produce one customer, so the allowable cost per qualified lead is $1,437. If your lead conversion rate through the stages is weaker than you think, this is where it shows up, because the cost per lead ceiling moves proportionally with it.
Then adjust for lead quality. If 40% of form fills are disqualified before they reach a salesperson, the allowable cost per raw form fill is $1,437 multiplied by 0.6, or $862. That is the figure to compare against what you are paying in Google Ads today.
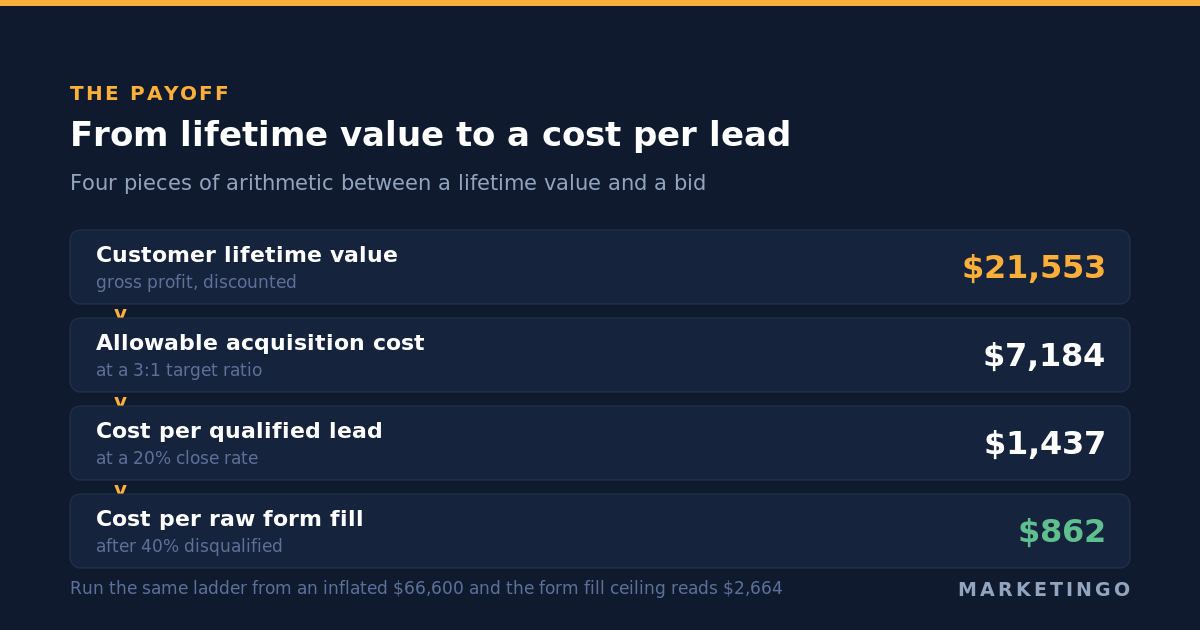
Run the same ladder from the inflated $66,600 and the allowable cost per raw form fill comes out at $2,664. A media team handed that number will find ways to spend it, because broad match and loose audiences will always absorb a higher cost per lead. The budget does not fail immediately. It fails about nine months later, when the cohort acquired at $2,664 a lead turns out to repay over eleven years rather than over the two the cash flow needed.
The lead generation return on investment calculator runs this ladder in both directions, so you can start from a cost per lead you are already paying and see which lifetime value would have to be true to justify it.
Segmenting the customer base by value
A single company-wide figure is the least useful version of this metric. The same arithmetic run per segment is what changes media decisions.
Split the customer base by acquisition channel, by first product purchased, by plan tier and by geography, then calculate CLV by customer group rather than in aggregate. The spread is usually wider than the average suggests: it is common for the top fifth of a customer base to carry a multiple of the value of each customer in the middle, and for one acquisition source to produce customers worth twice what another produces at the same cost per lead.
Three things follow from a value-segmented view of the customer base.
Bid differently for different segments. If a segment is worth twice as much, it can carry twice the acquisition cost at the same ratio. Without the segmentation you bid the blended number, which overpays for weak segments and underbids for your best customers.
Feed the values back into the platforms. Google Ads and Meta both optimise toward conversion values rather than conversion counts when you send them. Sending a real segment value instead of a flat one is the single most direct way customer behaviour reaches the bidding, and it is the practical payoff of doing the historic calculation at all.
Watch what a certain customer profile does after the first purchase. A segment that converts cheaply and never returns can look like your best performing campaign for two quarters. Measuring value rather than volume is what exposes it.
The ecommerce version, where lifetime is the wrong word
Subscription businesses have a churn event, so retention is observable. A direct to consumer brand does not. A customer who has not ordered in eight months has not cancelled anything, which makes the lifespan term in the popular formula an invention.
Replace it with a window and a contribution margin. Customer lifetime value over 12 or 24 months equals contribution margin per order multiplied by the number of orders placed in that window. Contribution margin per order is average order value minus the cost of goods, shipping, payment fees and returns, which is the same margin figure that sits underneath your break-even ROAS, where ROAS is return on ad spend.
An $80 average order value at a 35% contribution margin produces $28 per order. If a cohort averages 2.4 orders in its first 24 months, the 24-month CLV is $67.20. State the window every time. A brand quoting a 24-month figure and a brand quoting a 12-month figure are not comparing the same metric, and a brand quoting "lifetime" is quoting a guess.
The practical consequence for media buying is that the second order is usually where a direct to consumer brand becomes profitable. If first-order contribution margin is below your acquisition cost, which it almost always is on paid social, then the repeat rate in the first 90 days is the metric that decides whether scaling the account makes money. The ecommerce ROAS calculator is built around that margin arithmetic rather than around revenue multiples.
Raising CLV with the levers paid media controls
Most advice on how to increase CLV is about product and service quality, which is correct and is somebody else's job. Four levers sit inside the advertising function.
Acquire from sources with better retention, not just cheaper leads. Lifetime value varies more by acquisition channel than most teams measure. Branded search and referral traffic routinely retain better than broad prospecting, and the gap is often large enough that a higher cost per acquisition on the better channel still produces a better ratio. This requires passing the acquisition source through to your customer records, which is a conversion tracking job before it is a media one.
Bid by segment value rather than by volume. Once you have historic CLV per segment, feed it back as a conversion value instead of counting every lead as one conversion. Value-based bidding only works if the values you send are real, which is why the historic method matters even when the churn-based method sets the budget.
Exclude the segments that never repeat. Discount-led acquisition and competition entries can produce excellent first-order metrics and near-zero repeat rates. Removing them raises blended lifetime value without touching the product.
Advertise to existing customers deliberately. Expansion and repeat purchase are cheaper to buy than new customers and they move the retention term, which is the variable with the steepest effect on the result. This is a budget allocation decision, not a creative one.
What CLV does not measure
CLV is a financial measure, and treating it as a measure of the customer relationship leads teams astray.
It says nothing about customer satisfaction. A customer locked into an annual contract they regret produces the same revenue as a delighted one until the renewal date, so a high figure can sit on top of a deteriorating customer experience for a full year before the number moves. Net promoter score, support ticket volume and customer feedback are the leading indicators; CLV is the lagging one.
It says nothing about the customer journey that produced the value. Two customers worth the same amount can have reached that point through entirely different paths, one through a demo and a six-week sales cycle and the other through a self-serve signup, and those paths have different costs and different scalability.
It does not capture customer loyalty in any behavioural sense. Loyalty and inertia produce identical numbers. The distinction shows up only when a competitor gives the customer a reason to move.
It is also slow. Customer relationships over time are exactly what the metric is built on, which means improved customer experience this quarter will not appear in the calculation for a year or more. That lag is fine as long as nobody expects the number to respond to this month's marketing efforts.
The practical consequence is to pair it. Use CLV to decide what to spend, and use satisfaction and engagement measures to decide whether the number you are projecting is likely to hold.
When CLV is the wrong metric to steer on
Three situations where the number should not be driving the decision.
You have less than a year of cohort data. Any retention rate estimated from a few months of history is a projection of a projection. Use the CAC payback period instead, which is built almost entirely from things that have already happened and answers the cash question directly.
Cash is the constraint rather than profit. A business with nine months of runway and a customer who repays over five years has an affordability problem that a healthy CLV calculation will not show. Payback period is the right test.
The business or the pricing just changed. A repriced product, a new market or a changed packaging model invalidates the retention rate you measured on the old one. Rebuild the cohorts before trusting the multiple, and in the meantime run on cost per lead and close rate.
One note on a claim you will meet while researching this topic. The widely repeated figure that a 5% increase in customer retention raises profits by 25% to 95% is traced to work by Frederick Reichheld and W. Earl Sasser at Harvard Business Review in September 1990 and to Reichheld's later books. The HubSpot page cited above carries the claim as "recent research shows that a 5% increase in customer retention can lead to a 25%+ increase in profit" without naming a study, and attributes the wider 25% to 95% version to a quoted practitioner rather than to a source. Reichheld's own firm, writing on Bain and Company in October 2001, puts it qualitatively: "small increases in customer retention soon translate into big boosts to profits." The direction of the finding is sound and the arithmetic in the retention table above shows why. The precise range has travelled a long way from anything you can check, so use your own retention multiple rather than someone else's percentage.
Where to take this next
If you want the short version: calculate gross profit per customer per year, use gross retention rather than net, pick a discount rate on purpose, and compare the answer with your cohort curves before you build a budget on it.
MarketinGO builds this arithmetic into the account rather than keeping it in a spreadsheet beside it. For business to business software companies that means conversion tracking that carries segment value back into Google Ads and LinkedIn Ads bidding, so the platforms optimise toward the customers worth acquiring rather than toward the cheapest form fills. For an artificial intelligence compliance software client that approach took demo requests from a standing start to 10 a month and grew them 66%, on Google Ads and LinkedIn Ads run together, with no budget increase.
If your current cost per lead was set against a lifetime value nobody has rebuilt this year, a free ad audit will tell you what the accounts are actually paying per qualified customer, and which segments are carrying the result.