Customer retention rate is the percentage of the customers you had at the start of a period who are still customers at the end of it, excluding anyone acquired during the period. The formula is one line:
Customer retention rate = (customers at the end of the period − new customers acquired during the period) ÷ customers at the start of the period
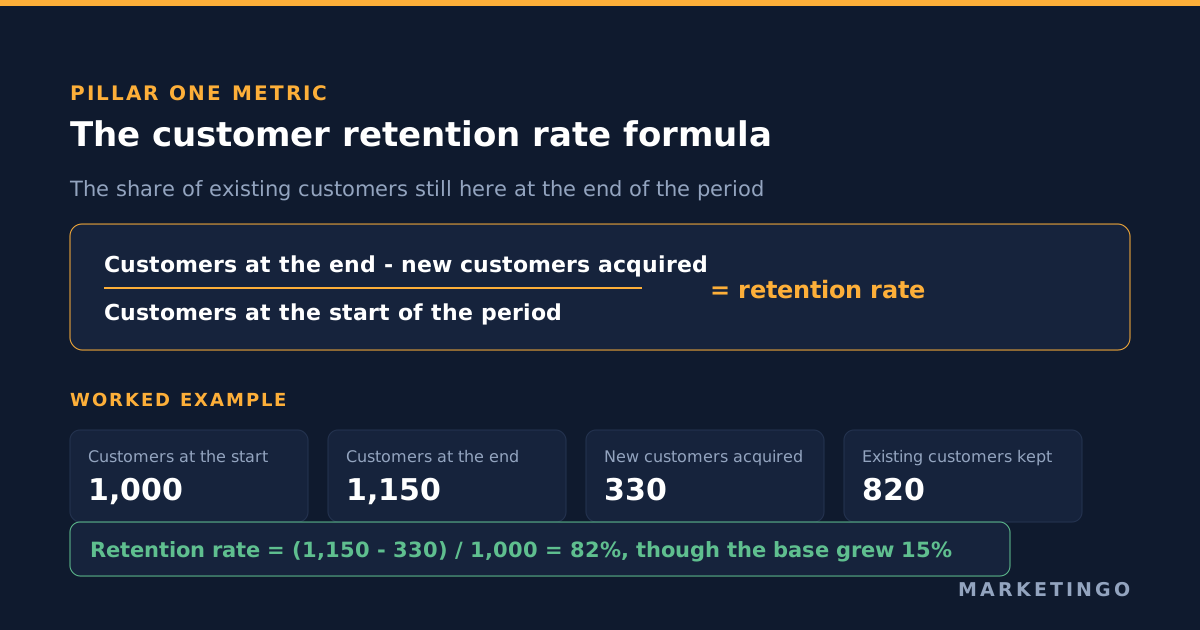
A business that began the quarter with 1,000 customers, ended it with 1,150, and acquired 330 new ones along the way, kept 820 of the original 1,000. The customer retention rate is 82%, even though the customer base grew by 15%. Those two facts sit in the same quarter and point in opposite directions, which is the first reason this metric is worth calculating properly.
What follows: what the number measures and the subtraction most people get wrong, how it relates to churn rate and to the other retention metrics, the 2026 benchmarks from primary data rather than from a statistics round-up, why the subscription benchmarks everyone quotes do not describe a non-subscription store, and the part that decides media budgets, which is how a retention rate sets the ceiling on what you can afford to pay for a customer.
What the customer retention rate formula measures, and the subtraction that gets dropped
The metric answers one question. Of the customers who were already here, how many are still here?
That is why new customers are subtracted. Leave the subtraction out and you are measuring growth, not retention, and the two can move in opposite directions in the same period without anything in the business contradicting itself. The quarter above is the ordinary case rather than an edge case: acquisition masked the loss of 180 existing customers, and a dashboard reporting only the headcount would have shown a good quarter.
Two definitional choices have to be made before the number means anything, and they are the reason two teams in one company often report different retention rates.
The first is what counts as a customer. Under a subscription business model the answer is easy, because there is a live contract or there is not. For a business where customers buy when they feel like it, a customer is only "retained" relative to a window you choose, and the window decides the answer. A store selling something people replace every eight months will look catastrophic on a quarterly window and healthy on an annual one, and neither number is wrong.
The second is whether you are counting customers or counting revenue. Customer retention rate counts people and weights the smallest account exactly like the largest. A business can keep 90% of its customers and lose 40% of its revenue in the same year by losing the wrong ten percent. Revenue weighting is what net revenue retention measures, and the two belong next to each other on the same page rather than in different reports.
How to calculate customer retention rate, step by step
- Fix the period and the definition of a customer, and write both down next to the number. Most of the disagreement about retention rates is a disagreement about windows that nobody has stated out loud.
- Count the customers active at the start of the period. Call this S.
- Count the customers active at the end of the period. Call this E.
- Count the customers acquired during the period who are still active at the end. Call this N. This is the step that is usually done wrong, because the number sitting in most reporting tools is all new customers acquired, including the ones who were acquired and then left inside the same period. Using that figure understates retention.
- Calculate (E − N) ÷ S and express it as a percentage of customers kept. Note that the denominator is the customer count at the start, never the total number of customers who touched the business during the period, which is a larger figure and produces a flattering answer.
Churn rate is the same measurement read from the other end: churn rate = 100% − customer retention rate. An 82% retention rate is an 18% churn rate. They are one number, and quoting both as though they were two findings is padding.
The window matters more than the arithmetic. Retention compounds, so the same business reports a very different figure monthly and annually, and the two are not interchangeable. A 2% monthly churn rate is not a 24% annual churn rate, because the survivors keep churning: it is closer to 22%, which Recurly's own calculation guidance states as well. Compare annual figures with annual figures, and be suspicious of any benchmark that does not say which it is.
Customer retention rate, repeat purchase rate and net revenue retention
Three metrics are routinely used as though they were the same one, and they answer different questions.
| Metric | What it counts | What it is good for |
|---|---|---|
| Customer retention rate | The share of existing customers still active at the end of a period | Whether the base is holding, independent of acquisition |
| Churn rate | The share who left | The same fact, stated as a loss |
| Repeat purchase rate | The share of customers who have bought more than once | Non-subscription businesses, where there is no contract to retain |
| Net revenue retention | The revenue a closed cohort still produces, after upgrades and downgrades | Whether the base is growing in money terms rather than headcount |
For a store with no subscription, repeat purchase rate is usually the honest version of this question and customer retention rate is a window-dependent approximation of it. For a business-to-business software company, customer retention rate and net revenue retention together say something neither says alone: a high customer retention rate with net revenue retention under 100% means you are keeping accounts and they are shrinking.
The customer retention metrics worth tracking alongside the rate
One rate on its own is a thin instrument. Five measurements together are what retention measurement in practice looks like, and each of them answers a question the others cannot.
Customer retention rate. The percentage of customers who stay. The rate measures headcount and nothing else, which is its strength and its blind spot.
Customer churn rate. The same fact as a loss. Churn rate shows how fast the base leaks, and high churn in a single month is easier to investigate than a retention rate averaged over a year.
Revenue churn rate. The percentage of recurring revenue lost in the period, rather than the percentage of customers. Revenue churn and customer churn separate every time account sizes differ, and the gap between them is the most useful single number in the pair: customer churn of 10% with revenue churn of 25% says the accounts leaving are the large ones.
Repeat purchase rate. The share of customers who have bought more than once, which in e-commerce is usually the metric that matters most. For a non-subscription business this is what customers coming back actually looks like in the data, and returning customers are the only population a store can measure without inventing a window.
Customer lifetime value. What the retained customer is worth in total, which is where customer value and the retention rate meet. Our walk-through of the customer lifetime value formula covers the three methods and which one a media budget can honestly use.
What does not belong on that list is an engagement rate. Logins, opens and session counts correlate with retention and are not retention, and a dashboard that reports engagement where it should report renewals is measuring the proxy rather than the sale.
Two practices matter more than adding a sixth metric to that list.
Track retention by cohort. A single retention rate for the whole customer base averages a group acquired at different times under different offers, and on a growing base it is dominated by whichever cohort happens to be largest. Cohort analysis, meaning retention measured separately for the customers acquired in each month, is what separates a product that is getting stickier from a company that simply sold more last year. Retention data reported as one figure per quarter cannot show that; the same data split by acquisition month can.
Read it for different customer segments. A blended figure hides the fact that the segments you can afford to pay most for are rarely the ones taking most of the budget. Splitting the rate by plan, by channel of acquisition and by first product bought is usually the first time anyone sees that two of the segments have poor retention and the third is carrying the business.
What a good customer retention rate is in 2026: the average customer retention rate by industry
Most of the figures circulating as the average customer retention rate by industry are a statistics round-up citing another statistics round-up, and the industry average they report usually has no date and no sample attached. The figures below come from one dataset, Recurly's network of subscription businesses, published with the month the data covers. Software as a service has the highest retention in it, education the lowest.
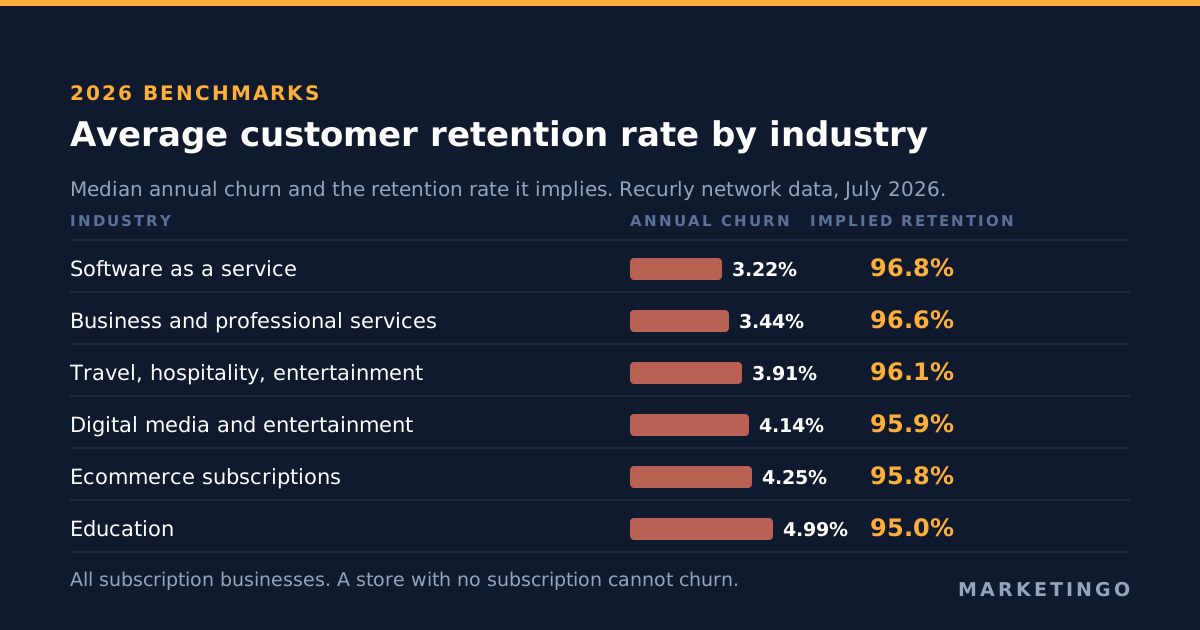
| Industry | Median annual churn rate | Implied annual retention rate |
|---|---|---|
| Software as a service | 3.22% | 96.8% |
| Business and professional services | 3.44% | 96.6% |
| Travel, hospitality and entertainment | 3.91% | 96.1% |
| Digital media and entertainment | 4.14% | 95.9% |
| Ecommerce, meaning subscription boxes and direct-to-consumer subscriptions | 4.25% | 95.8% |
| Education | 4.99% | 95.0% |
Source: Recurly network data for July 2026, published in Recurly's churn rate benchmarks. Recurly splits the same figures into voluntary churn, meaning customers who chose to leave, and involuntary churn, meaning payments that failed, and reports an average of 2.34% voluntary and a median of 1.25% involuntary across all industries. Roughly a third of the churn in that dataset is a billing failure rather than a decision, which is a useful thing to know before anyone writes a retention strategy.
Two honest notes about that table, because a benchmark presented without its limits is how bad decisions get made.
The page itself is not internally consistent. It reports a median annual churn rate of 3.22% for software as a service in its questions section and 3.04% for software businesses in its body, and 3.21% for business and professional services in the text against 3.44% in the chart. We have used the higher figure in each pair and named the source so the difference is visible rather than smoothed over. That inconsistency sits inside the most widely cited churn dataset in the category, and almost every article quoting it reports one of the two numbers as though it were the only one.
Recurly also reports that churn falls as average revenue per customer rises, from 4.29% a year in the ten to twenty five dollar band down to 2.87% in the one hundred to two hundred and fifty dollar band. Cheap subscriptions churn harder. If your benchmark comparison ignores price point it is comparing two different businesses.
Why these benchmarks do not describe your store
Every figure above comes from subscription businesses. The row labelled ecommerce is subscription boxes and direct-to-consumer subscription programmes, not a store where people buy when they need something.
This gets quoted at non-subscription retailers constantly, and a 95.8% annual retention benchmark is meaningless to a store whose customers have no contract to cancel. There is nothing to churn out of. For that business the equivalent questions are what share of customers ever buy a second time, how long the gap between the first and second order is, and what the average order value does on the repeat order. A single-figure retention benchmark borrowed from the subscription world will flatter a non-subscription store at any window short enough and condemn it at any window long enough.
The practical test: if a customer can stop being a customer without doing anything, retention rate is a window-dependent estimate and should be reported with the window attached. If they have to actively cancel, retention rate is a fact.
Customer retention rate sets the ceiling on what you can pay for a customer
This is the part the retention literature does not reach, and it is the only part that changes a media plan.
At a steady retention rate, the average customer lifetime in periods is one divided by one minus the retention rate. A 75% annual retention rate gives an average customer life of four years. Multiply by the gross profit a customer produces per year and you have the lifetime gross profit; divide that by the ratio you are willing to run and you have the most you can afford to pay to acquire a customer.
Take a business where a retained customer produces $400 of revenue a year at a 60% gross margin, so $240 of annual gross profit, and run it at five retention rates against a three-to-one lifetime-value-to-acquisition-cost target.
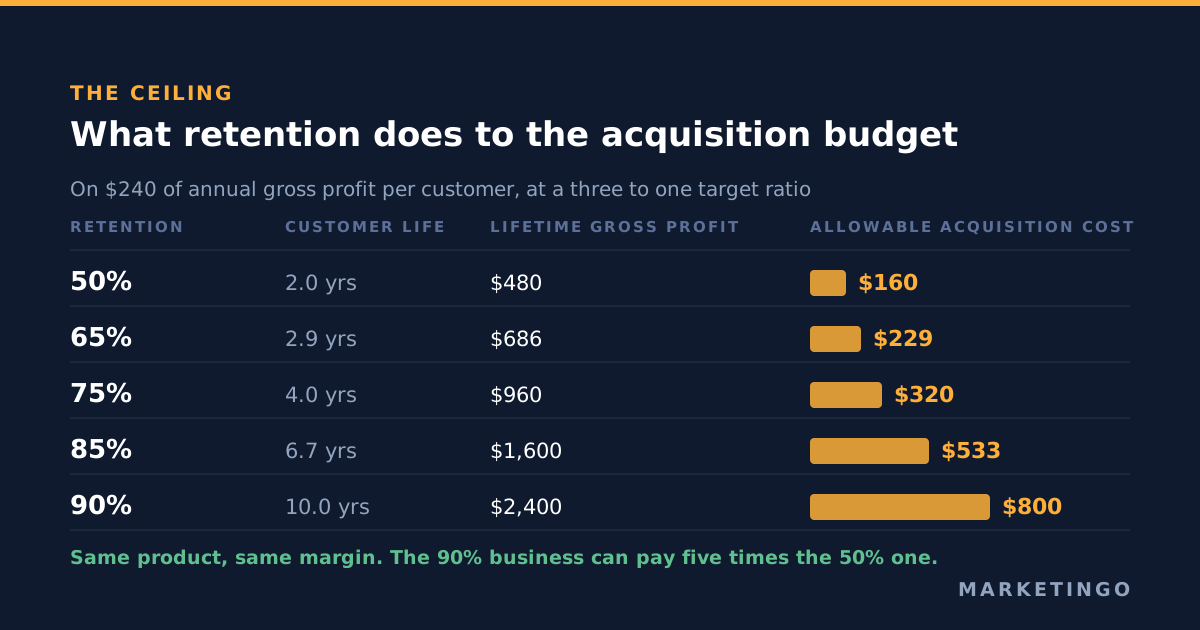
| Annual retention rate | Average customer life | Lifetime gross profit | Allowable acquisition cost at 3:1 |
|---|---|---|---|
| 50% | 2.0 years | $480 | $160 |
| 65% | 2.9 years | $686 | $229 |
| 75% | 4.0 years | $960 | $320 |
| 85% | 6.7 years | $1,600 | $533 |
| 90% | 10.0 years | $2,400 | $800 |
Same product, same price, same margin, same target ratio. The business at 90% retention can pay five times what the business at 50% can pay for the identical customer. In an auction, whoever can afford the highest cost per acquisition takes the impressions that convert, so a competitor outbidding you on every commercial keyword is not necessarily better funded. They may simply be keeping more of what they sell.
Two caveats, because the arithmetic above is deliberately plain. It is undiscounted, which overstates the later years, and the discounted version plus the reason the popular lifetime value formula overstates its answer by roughly three times is worked through in our piece on the customer lifetime value formula. And it says nothing about when the money arrives, which is the separate constraint in CAC payback period. Retention sets the ceiling; payback decides whether you can reach it.
To run the chain on your own figures rather than this example, the ecommerce return on ad spend calculator works from margin and order value to a break-even return, and the lead generation return on investment calculator does the same from deal value and close rate down to an allowable cost per lead.
The famous 5% claim, and the one starting point where it is true
Somewhere in almost every article about retention sits a version of this sentence: increasing customer retention by five percent increases profits by twenty five to ninety five percent. It is usually attributed to Bain & Company, sometimes to Harvard Business Review, and almost never with a figure anyone has checked. Customer retention can increase profits sharply, and that is exactly why the sentence deserves checking rather than repeating.
Here is what the primary sources say. The research belongs to Frederick Reichheld of Bain & Company and W. Earl Sasser of Harvard Business School, whose paper "Zero Defections: Quality Comes to Services" ran in the September to October 1990 issue of Harvard Business Review. Bain's own published brief on the subject states it narrowly: "In financial services, for example, a 5% increase in customer retention produces more than a 25% increase in profit." That sentence is from Bain's prescription for cutting costs, written by Reichheld. One industry, one figure, and the word "example" doing a lot of work.
So where does the range of twenty five to ninety five come from? It comes from the same relationship measured across different industries, and the arithmetic in the section above explains why one relationship produces such a wide range. Apply a five percent relative improvement to the retention rate and look at what happens to lifetime gross profit per customer.
| Starting retention rate | After a 5% relative improvement | Increase in lifetime gross profit per customer |
|---|---|---|
| 50% | 52.5% | 5% |
| 60% | 63.0% | 8% |
| 70% | 73.5% | 13% |
| 80% | 84.0% | 25% |
| 85% | 89.3% | 39% |
| 90% | 94.5% | 82% |
The claim is not a constant. It is a curve, and the twenty five percent figure Bain published lands almost exactly on a starting retention rate of 80%, which is roughly where the retail financial services businesses in that research sat. The top of the quoted range, ninety five percent, corresponds to a starting retention rate of about 91%. The famous span of twenty five to ninety five is not a range of outcomes available to any business. It is the range of outcomes available to businesses that already retain between eight and nine customers in ten.
If you retain half your customers, a five percent relative improvement is worth about five percent more lifetime gross profit, not twenty five. The claim as repeated is roughly five times too optimistic for exactly the businesses most likely to be reading it, because a business with a retention problem is by definition not starting at 90%.
Two further things are worth saying plainly. The table models lifetime gross profit per customer at a steady retention rate, undiscounted; it explains the shape of the published claim rather than reproducing Bain's own profit measurement, which included costs the model does not. And "a 5% increase in retention" has never been defined in the places it is quoted: five percentage points from 80% to 85% produces a 33% increase on this model, against 25% for the relative reading. The ambiguity alone moves the answer by a third, which is a reasonable sign that the sentence has been travelling without its sources for a while.
The companion claim, that acquiring a customer costs five times what retaining one costs, we do not use. We could not trace it to a primary study, only to secondary citations of secondary citations, and a figure nobody can source is not a figure to plan a budget around.
Each point of retention is worth more than the last
The curve above has a practical consequence that gets lost in the rounding.
Going from 50% to 55% retention adds about $18 to the acquisition cost you can afford on the $240 gross profit example. Going from 85% to 90% adds about $267. Identical five-point improvement, roughly fifteen times the effect. So the question is never whether to boost retention but where on the curve the business currently sits, because the same effort spent to boost customer retention rates pays back very differently at the two ends of it.
This argues against the usual order of operations. The standard advice is to fix retention when it is bad, which is sensible as damage control and is the weakest place to buy incremental retention. The money sits at the top of the range, where a business is already keeping most of its customers and one more point of retention buys several more months of customer life. Companies that already retain well are the ones for whom a retention project repays a media budget, which is also why the businesses that can outbid everyone tend to be the ones that already had the fewest problems.
What actually moves customer retention, and who owns each lever
Customer retention strategies are the most written-about part of this subject and the least honestly attributed. Almost every factor that impacts customer retention sits outside the marketing department, and a paid media agency claiming otherwise is selling something. Here is the split, stated plainly, because knowing which team owns a lever is what makes a retention project finish.
Owned by product and customer success. Customer onboarding is the single largest determinant of whether customers stay in software as a service, because a customer who never reached the thing they bought the product for has no reason to renew. The same applies to any business model where value arrives after the purchase rather than at it. Customer success teams exist for this reason, and software as a service customer retention strategies are mostly onboarding strategies wearing a different name.
Owned by service and support. Customer support quality, response time and whether a complaint gets resolved on first contact are most of what customer experience amounts to in practice, and they feed customer satisfaction directly, and customer satisfaction is the best available leading indicator of whether a customer renews. Customer feedback is worth collecting only where somebody is accountable for acting on it; a survey nobody reads produces retention data and no retention.
Owned by finance and billing. The cheapest retention work available in most subscription businesses is payment recovery, because a failed card is a customer who did not choose to leave. In the Recurly dataset a third of churn is involuntary, which means a third of the problem is a dunning sequence rather than a relationship.
Owned by pricing and packaging. Churn falls as price rises in that same dataset, which is not an argument for raising prices but is an argument for being careful about what the cheapest plan attracts. A revenue stream built on the lowest tier is a revenue stream with a retention problem designed into it.
Owned by marketing, partly. Brand loyalty and customer loyalty are real, and a loyalty program is a genuine lever in ecommerce and hospitality where repeat purchase is the whole model. They are also where most of the advice on how to improve your customer retention rate stops, which is why so much of it fails to change the number: a loyalty program cannot keep customers a bad onboarding has already lost.
The three levers paid media actually controls
Three of them sit inside the accounts, and MarketinGO does not sell any of the others above.
Who you acquire. Retention is partly decided before the first sale, by which audiences, keywords and offers brought the customer in. Discount-led acquisition and broad prospecting buy cohorts that churn faster than search demand for the specific product does, and the difference shows up months after the campaign was judged a success. If platform reporting stops at the first conversion, every channel looks equally good at buying customers who stay.
What you optimise toward. A campaign optimising to a first purchase finds the people most likely to make one, which is a different population from the people most likely to make four. Sending a value signal back to the platform, or a later event such as a second order or a qualified opportunity rather than a form fill, changes who the bidding algorithms pursue. The mechanics are in Google Ads conversion tracking, and the same logic applied to lead quality is in marketing qualified lead.
Which cohorts you are allowed to pay more for. Once retention is measured by segment rather than in aggregate, the acquisition cost ceiling differs per segment, often by a multiple. That is a bidding instruction rather than a reporting nicety: it says where to spend more and where you are currently overpaying. We work this through on the accounts we run, which is why our ecommerce reporting carries profit alongside return on ad spend, as in the dental supplies ecommerce case study, and on the business-to-business side the same chain is what the high-ticket business-to-business and ecommerce and direct-to-consumer pages describe.
When customer retention rate is the wrong number to steer on
Three situations where the metric misleads.
When accounts differ wildly in size. A business keeping 90% of customers and 60% of revenue has a retention problem that customer retention rate cannot see. Read it next to a revenue-weighted figure or you will be reassured by the wrong number.
When the customer base is growing fast. A high retention rate on a base that doubled last year is a statement about a small, old cohort. Retention measured on a cohort basis, by acquisition month, is the version that survives growth.
When there is no contract and no natural purchase cycle. For a business selling something bought once every few years, retention inside any practical window is close to meaningless and repeat purchase rate over a long window is the better question.
Where to take this next
The sequence worth running, in order: fix the window and the definition of a customer and write both next to the number, recalculate retention with new customers properly excluded, split it by acquisition cohort and by segment, then put each segment's retention through the acquisition cost ceiling table above and compare that ceiling with what you are paying today.
The companion metrics are customer acquisition cost, which is the number the ceiling constrains, and the lifetime value to acquisition cost ratio, which is the test the two are put to together. The rest of the profit metrics we work from sit on the resources hub.
If that arithmetic says your allowable acquisition cost is well above what you are currently paying, the accounts are probably under-funded rather than badly run. If it says the opposite, the accounts need work before the budget does. A free ad account audit will tell you which of the two it is in about a week, using your own numbers rather than a benchmark, and the Google Ads service page describes how we work once an account is live.