Paid media strategies, benchmarks and playbooks for B2B pipeline and DTC revenue.
21 articles, page 1 of 3
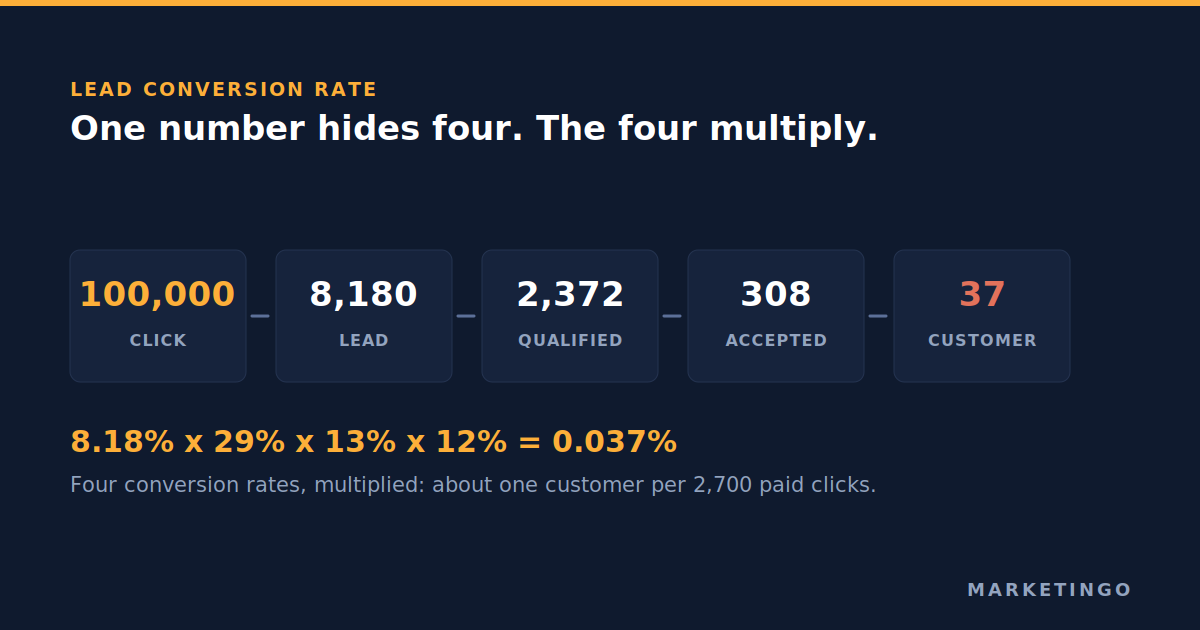
Most teams report one lead conversion rate and steer on it. A paid media budget crosses four separate conversion rates on its way to a customer, they multiply rather than average, and the published benchmarks for each one are measured on different denominators. Here is the formula, the 2026 benchmark tables with their sample sizes attached, the widely repeated figure that turns out to have no original source, and the arithmetic that tells you which stage is costing you the most.
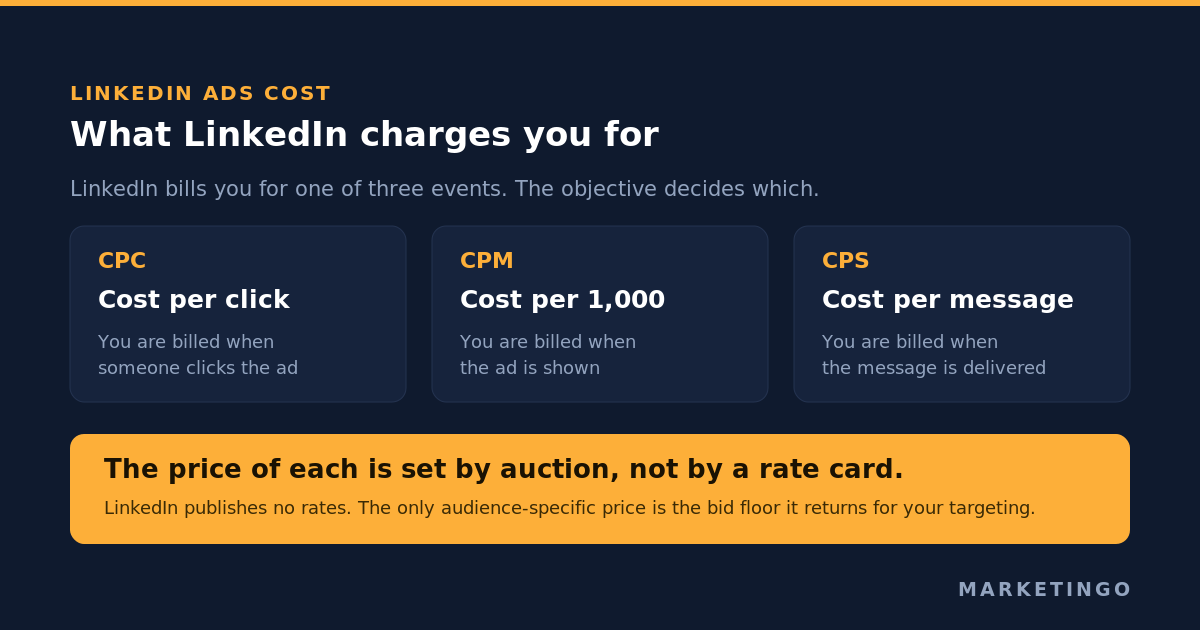
LinkedIn Ads cost is decided by an auction, not a rate card, and LinkedIn's own pricing page contains no prices at all. The published averages contradict each other by a factor of three on clicks and five on impressions. Here is what LinkedIn does document, how to pull the bid floor and suggested bid for your exact audience, why a cost per click cannot be compared across campaign objectives, and how to work back from break-even cost per lead to a budget that survives a quarter.
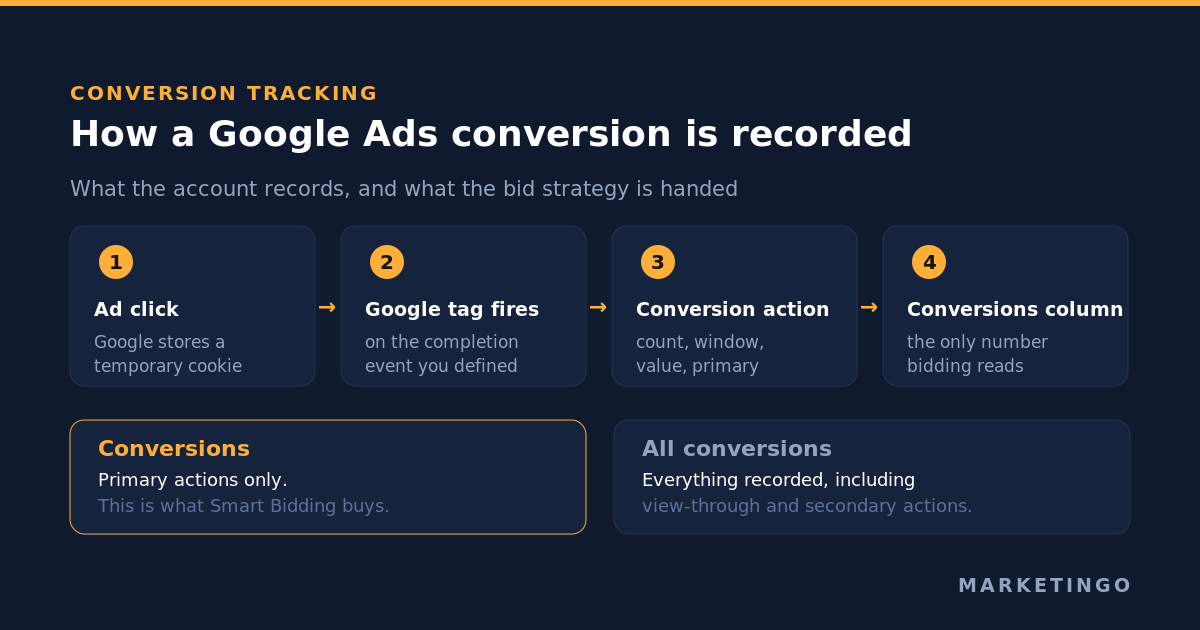
Most guides to Google Ads conversion tracking stop once the tag fires. The tag is the easy part. What decides whether Smart Bidding buys customers or form interactions is five settings underneath it, plus one documented exception that quietly overrides two of them.
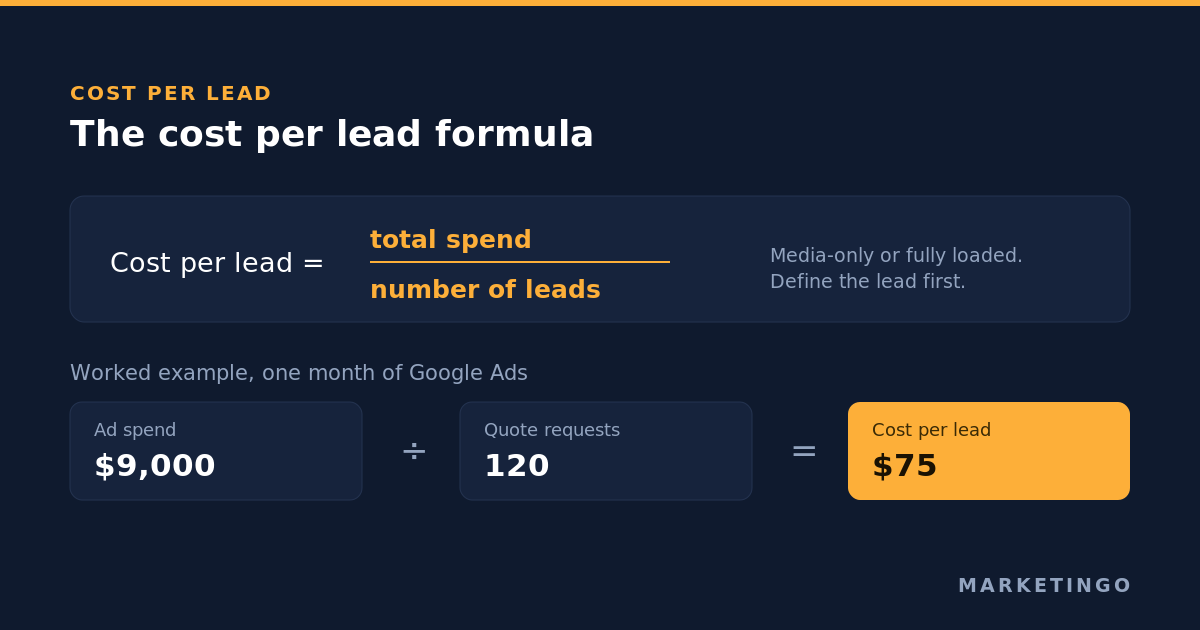
Cost per lead is total spend divided by leads generated. The useful question is not what the average CPL in your industry is, but what your own economics allow: gross profit per customer multiplied by your close rate is your break-even cost per lead, and a good CPL sits 20% to 30% below it. Here is the formula, the 2026 benchmark tables, the reason two respected datasets disagree by up to 6x for the same industry, and when a rising CPL is the best news in the account.
Most rankings of the best PPC agencies rewrite the same directory blurbs. This one opened every agency's case studies and checked whether the numbers hold up.
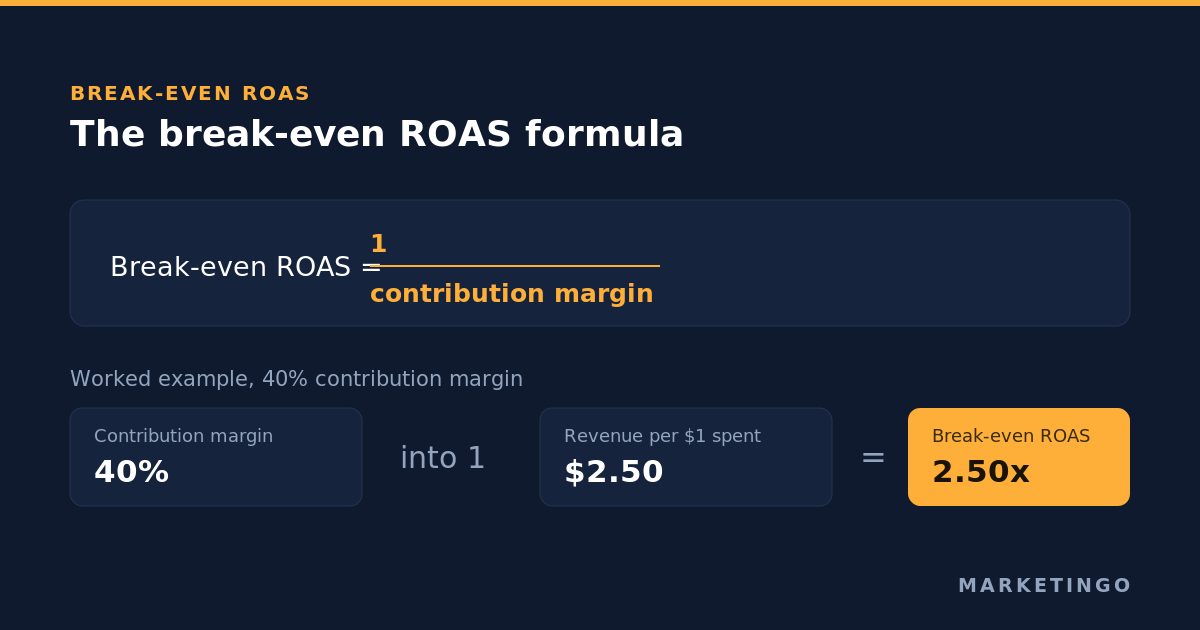
Break-even ROAS is the return on ad spend at which advertising stops losing money. The formula everybody publishes uses gross margin and understates the real floor by more than 80% on a typical store. Here is the version that includes fees, fulfilment and returns.
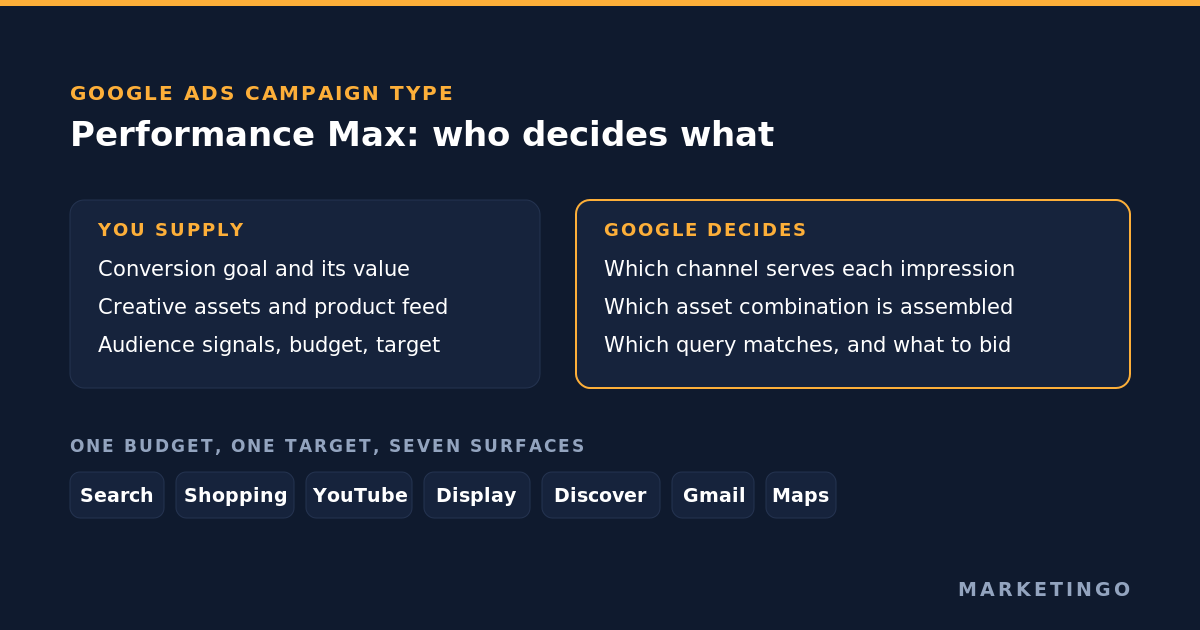
Performance Max stopped being a black box some time in 2025, and most advice about it has not caught up. Here is what the campaign type optimises for, every control that exists today, what the reporting now exposes, and the two 2026 changes that quietly moved the numbers in live accounts.
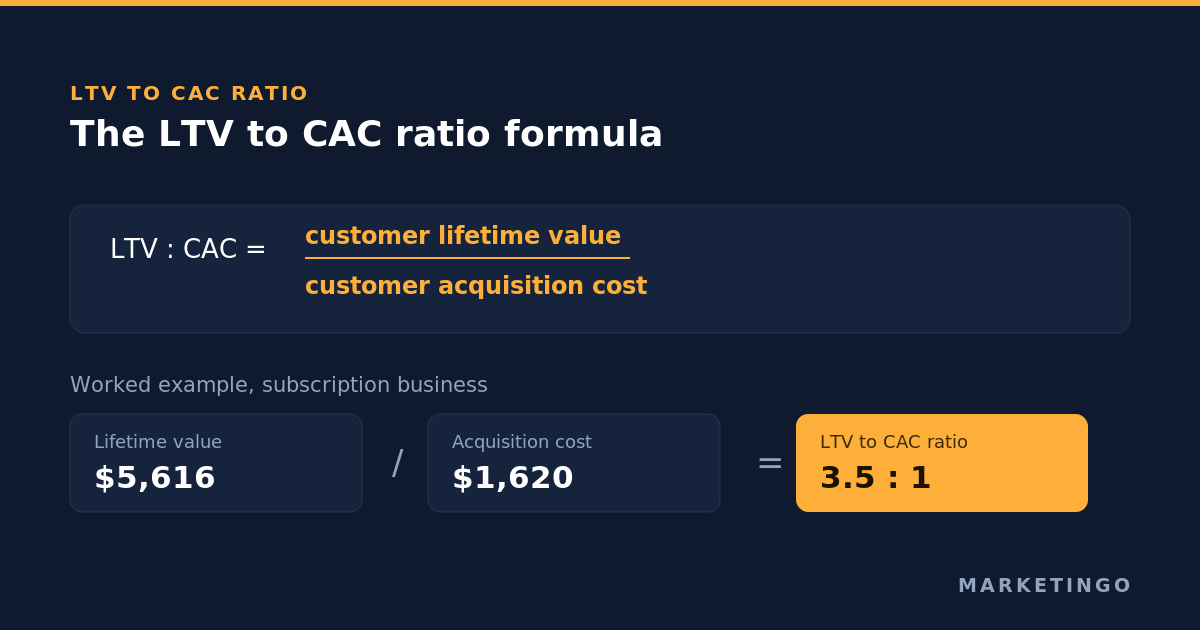
The LTV to CAC ratio divides customer lifetime value by customer acquisition cost. Here is how to calculate both halves properly, what the 3:1 rule really says in its original source, why CAC payback period is the sturdier number, and why the ratio decays as you scale spend.
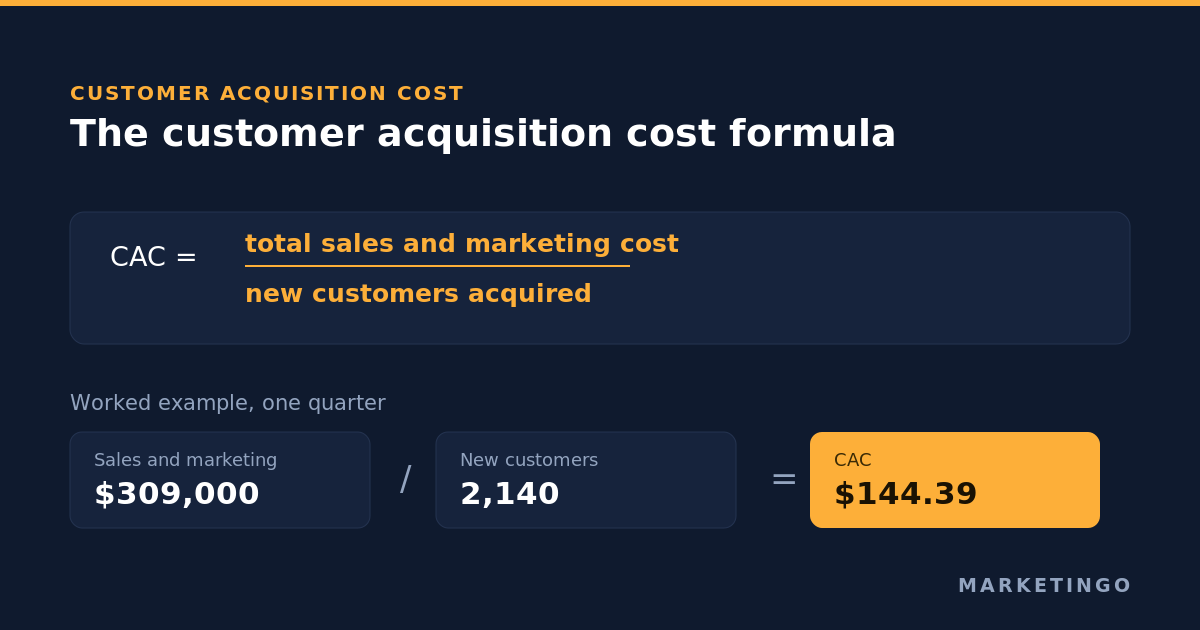
Customer acquisition cost is total sales and marketing spend divided by new customers acquired. Here is how to calculate CAC from ad platform data that counts conversions instead of customers, the break-even number your margin implies, and where the 3:1 LTV to CAC rule actually came from.
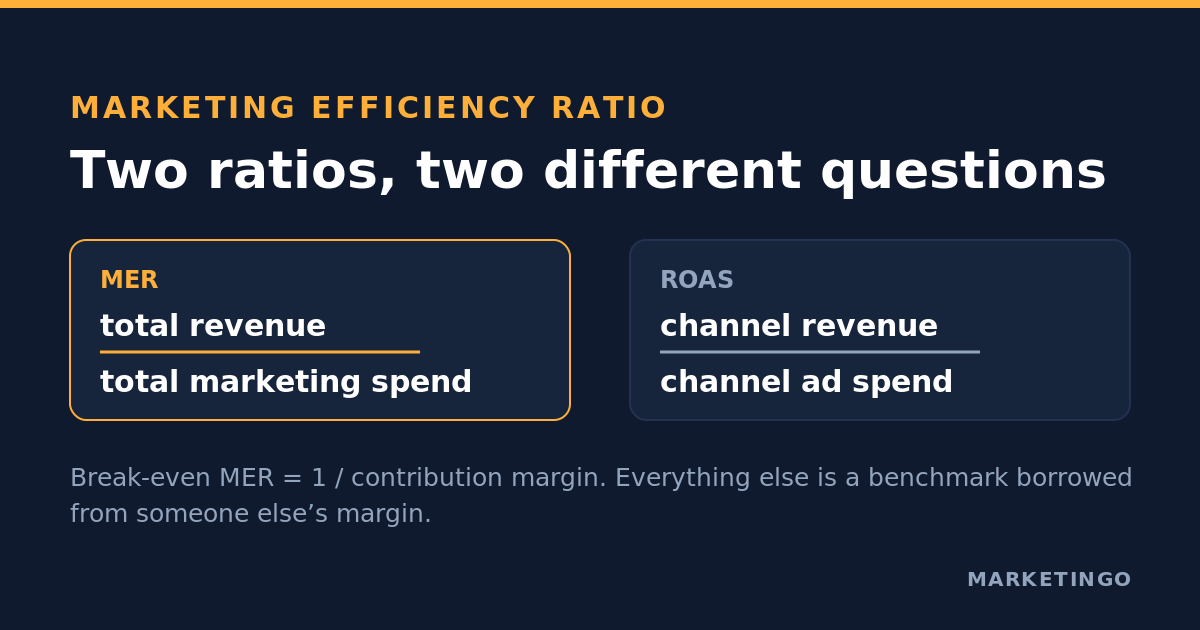
MER is total revenue divided by total marketing spend. Here is the formula, what a good marketing efficiency ratio looks like by revenue stage, the break-even number your margin implies, and the rule for deciding when to act on MER instead of platform ROAS.
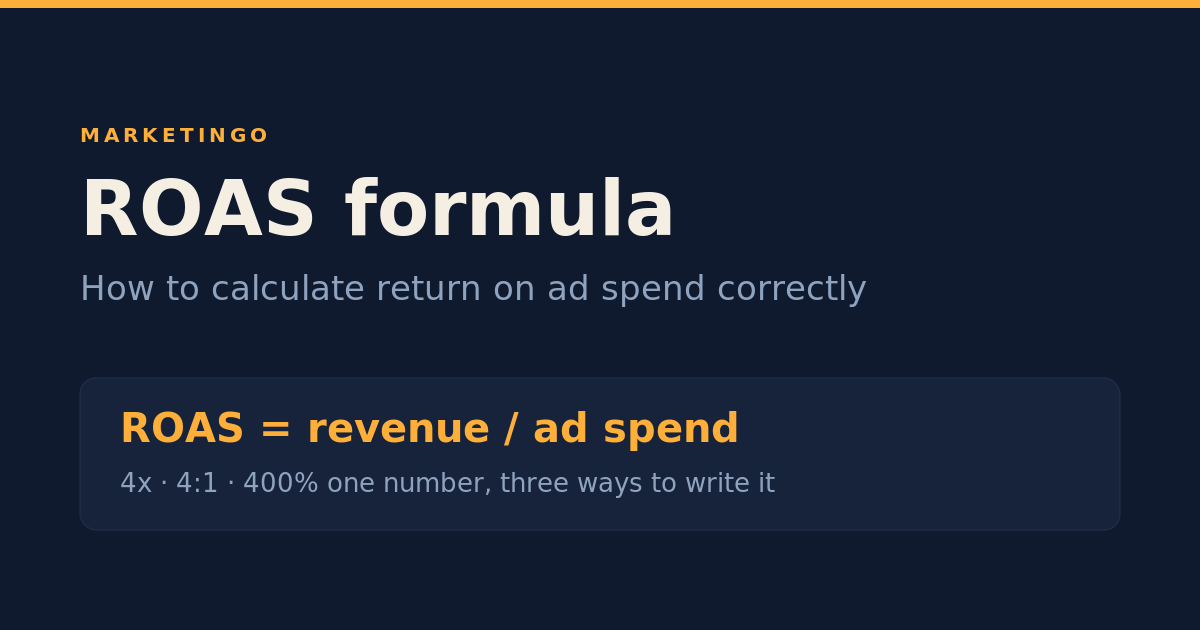
Return on ad spend is one division, and almost everyone gets the inputs wrong. Here is the ROAS formula, what the number means, the four ROAS figures a single account can produce, and the percentage-versus-ratio trap in Google's target ROAS field.
A practitioner's comparison of 11 PPC agencies for B2B SaaS, with the channels each runs, the trials and pipeline they can prove, and the type of SaaS each is built for.
A practitioner's comparison of 11 Meta Ads agencies for DTC ecommerce, with the way each runs Facebook and Instagram, the results they can prove, and the brand each is built for.
A practitioner's comparison of 11 Google Shopping agencies for ecommerce, with the feed and Performance Max approach each runs, the ROAS and revenue they can prove, and the type of online store each is built for.
A practitioner's comparison of 11 LinkedIn Ads agencies for B2B, with the account structure each runs, the pipeline and cost per lead they can prove, and the type of company each is built for.
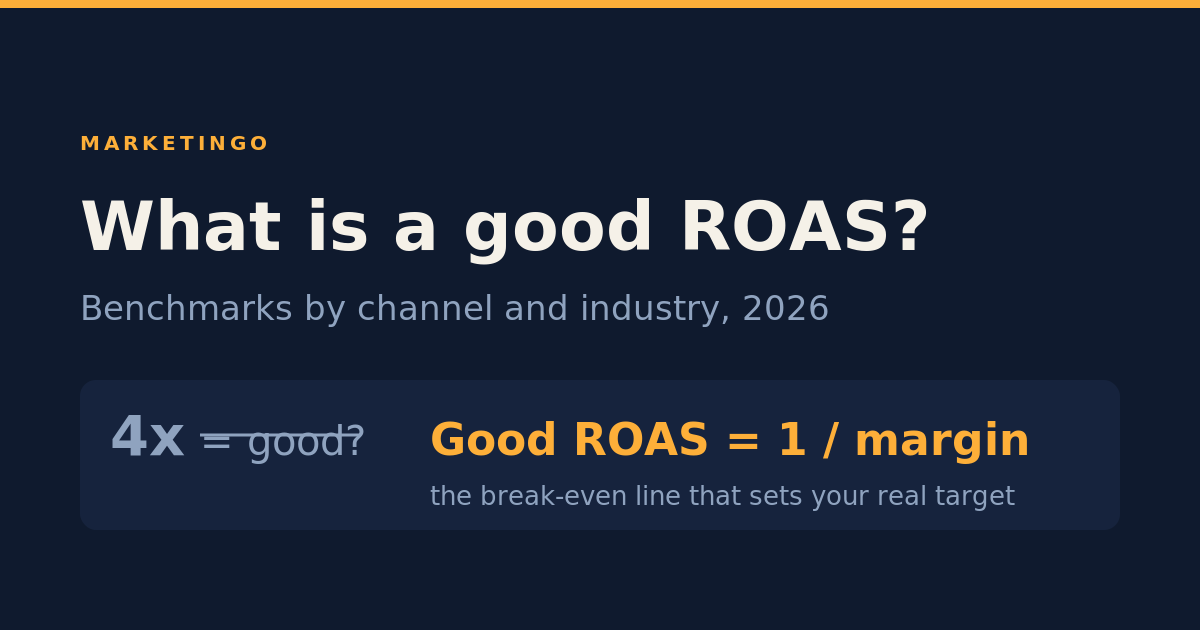
A practitioner's guide to what a good ROAS actually is in 2026: benchmarks by channel and industry, the break-even math that decides your real target, and why the headline number matters less than the profit underneath it.
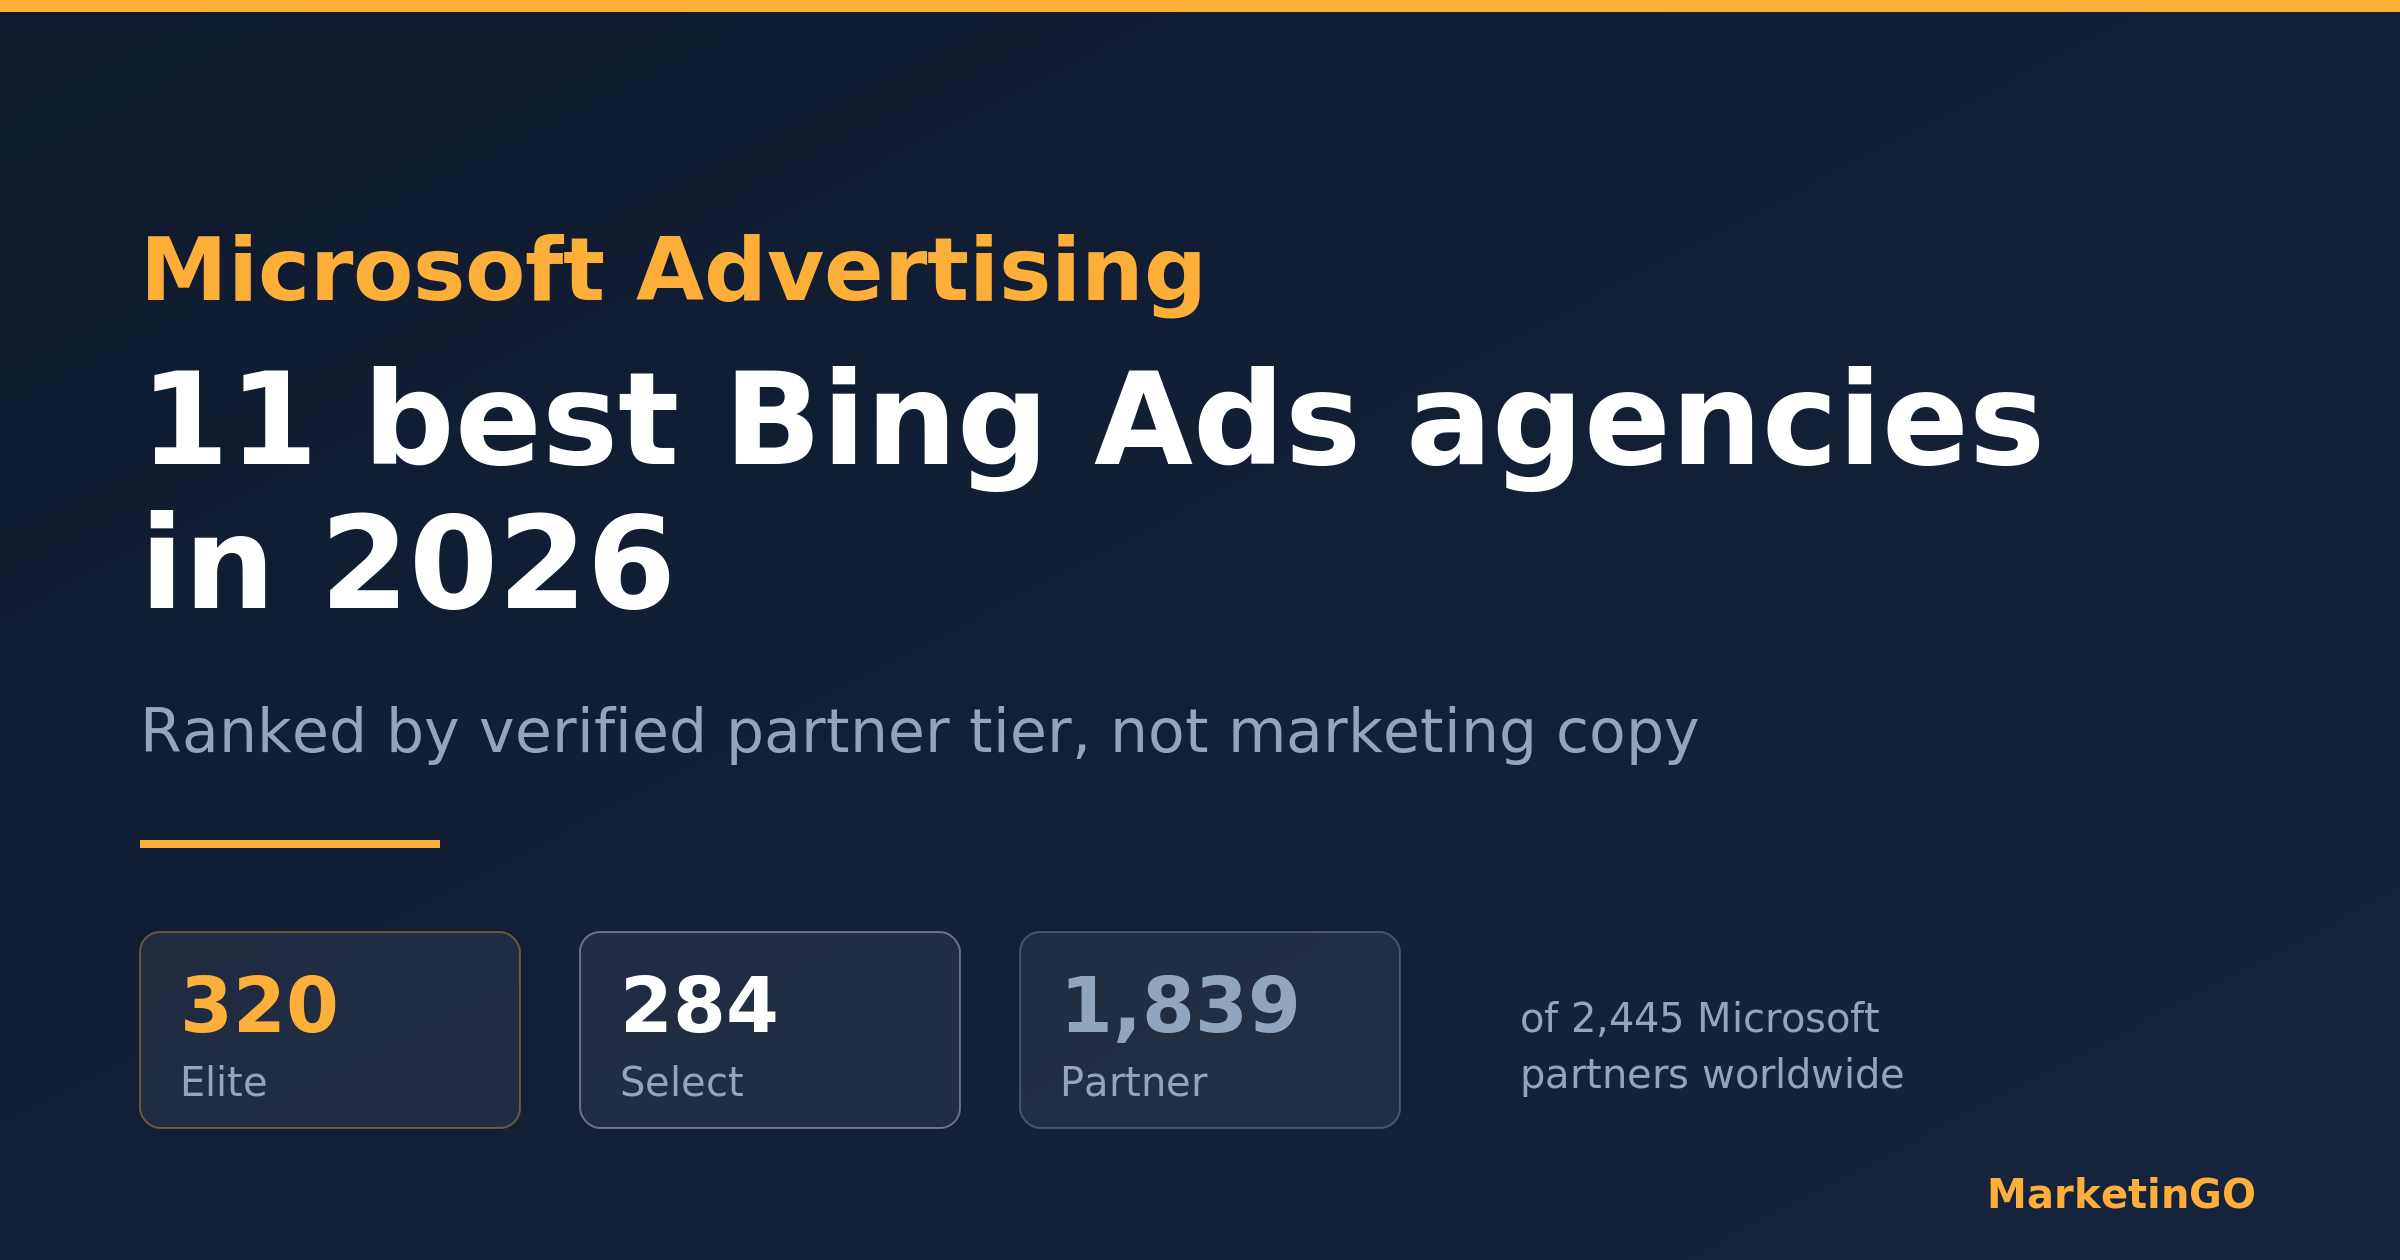
Most Bing Ads agency lists repeat partner claims nobody checked. This one ranks 11 agencies against Microsoft's own partner directory, names the tier each one actually holds, and flags the CPC statistic the whole category quotes without a source.
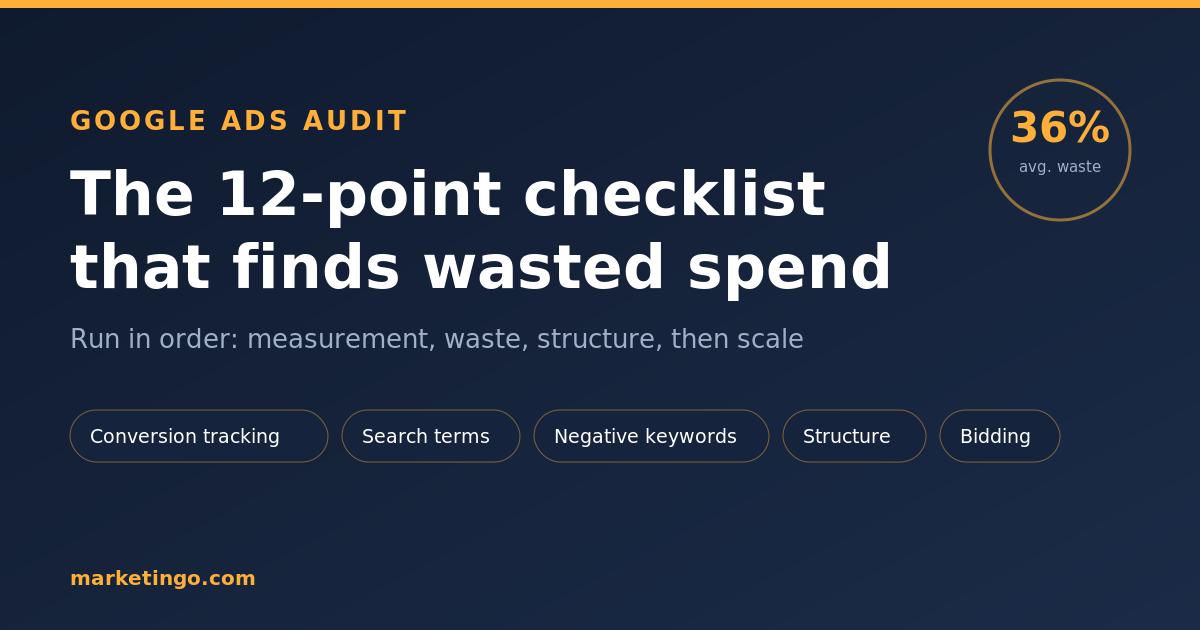
A practitioner's Google Ads audit checklist: the 12 checks that find wasted spend in a live account, the order that stops you fixing the wrong thing first, and what the 2026 automation changes mean for the review.
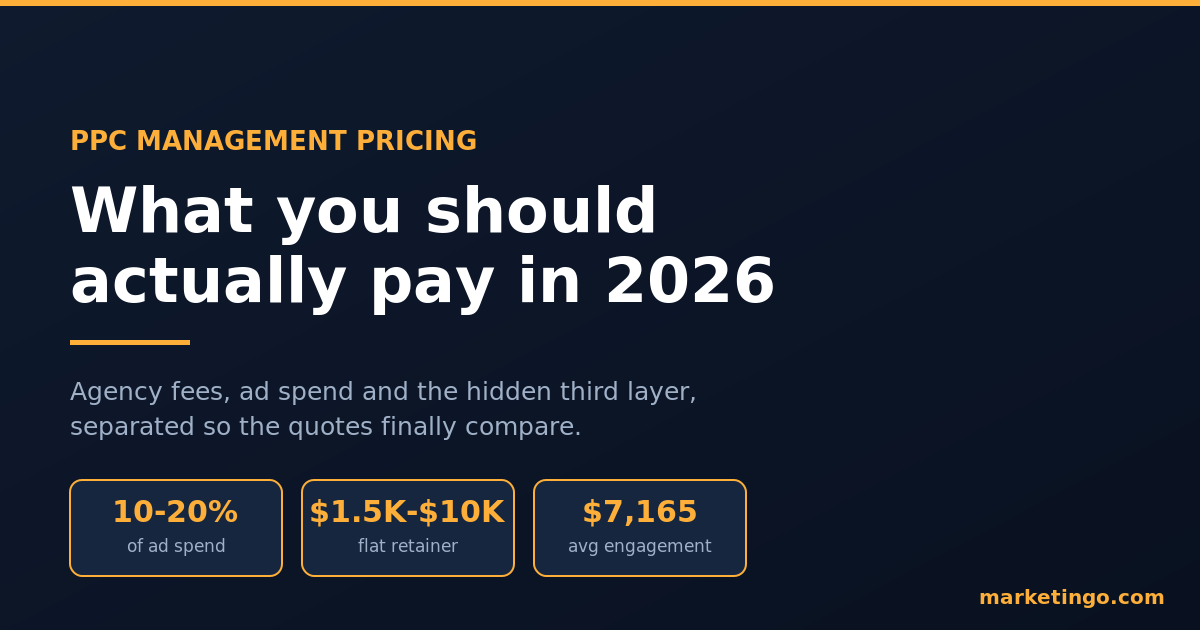
Most PPC pricing guides are written for agencies deciding what to charge. This one is written for the person paying the invoice: real 2026 fee ranges, the four models compared, and a profit-based test for whether your fee is fair.
A practitioner's comparison of 11 B2B paid media agencies, with the channels each runs, the pipeline they can prove, and the type of technology company each is built for.
A practitioner's comparison of 11 ecommerce PPC agencies, with the channels each runs, the results they can prove, and the type of store each is built for.