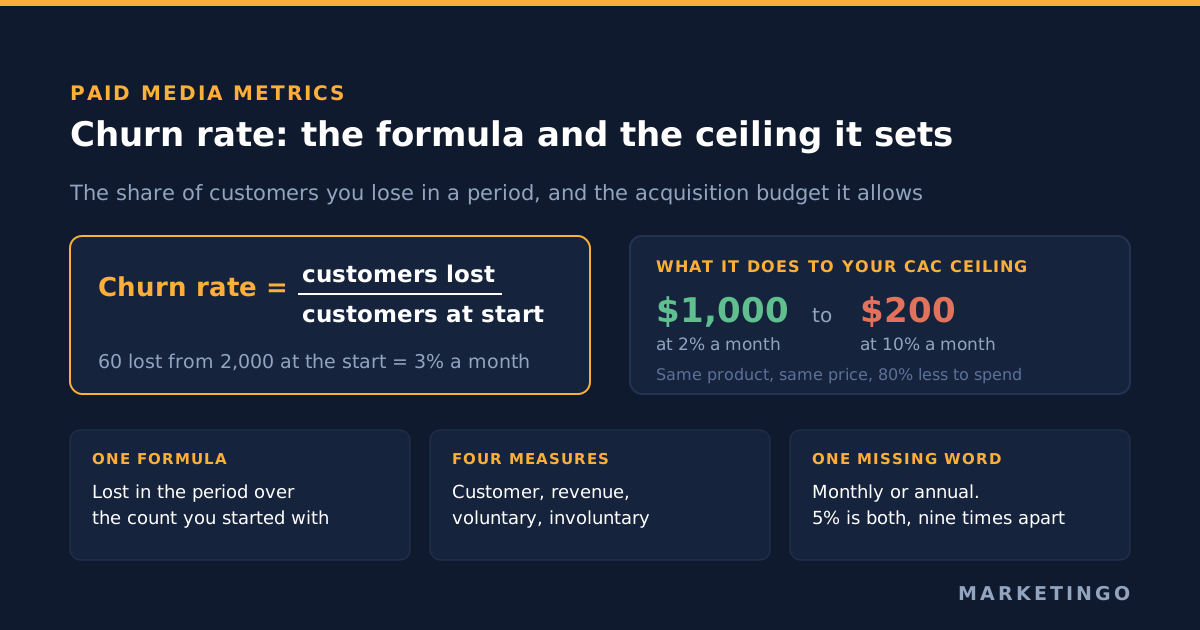
Churn rate is the percentage of customers who stop being customers during a period. The customer churn rate formula divides the number of customers lost in the period by the number you had at the start, then multiplies by 100. A business that began the month with 2,000 customers and lost 60 has a monthly churn rate of 3%, because 60 divided by 2,000 is 0.03.
That formula takes one line. Everything that goes wrong with the metric happens around it: in the denominator, in the period nobody states, and in the gap between losing a customer and losing the revenue that customer carried.
How to calculate churn rate, and the denominator that breaks it
The churn rate formula in its standard form:
Churn rate = (customers lost during the period / customers at the start of the period) × 100
Recurly, whose payments network supplies most of the public benchmark figures in this category, defines it the same way and states the calculation as dividing subscribers lost in a period by subscribers at the start of that period, then multiplying by 100 (Recurly churn rate benchmarks, July 2026 data).
The customers you acquired during the period are deliberately excluded from the denominator. This is the part most churn rate calculations get wrong, and the error always runs in the same direction.
Suppose you start the month with 2,000 customers, add 400, and lose 60. Dividing 60 by the starting 2,000 gives 3%. Dividing 60 by the 2,400 you touched at some point in the month gives 2.5%. Dividing by an average of the start and end balances gives something in between. The faster you are growing, the further apart those three numbers sit, and a company adding 20% to its customer base every month can report a churn rate a third lower than its real one simply by picking the friendliest denominator.
Fix it by rule rather than by preference. Track churn against a fixed denominator: count only customers who were present at the start of the period, and treat customers acquired inside the period as their own cohort. A new customer who signs up on the 12th and cancels on the 26th belongs in that cohort's first-month churn, not in this month's blended figure, and burying them in the blended figure is how businesses hide the cliff that happens in the first 90 days.
Monthly churn and annual churn are not the same number
Churn compounds. A 2% monthly churn rate does not produce 24% annual churn, because each month's 2% applies to a base already reduced by the months before it. Recurly makes the point explicitly: a 2% monthly rate works out at roughly 22% a year rather than 24%.
At low rates that gap is a rounding question. At the rates people actually quote it is the whole argument.
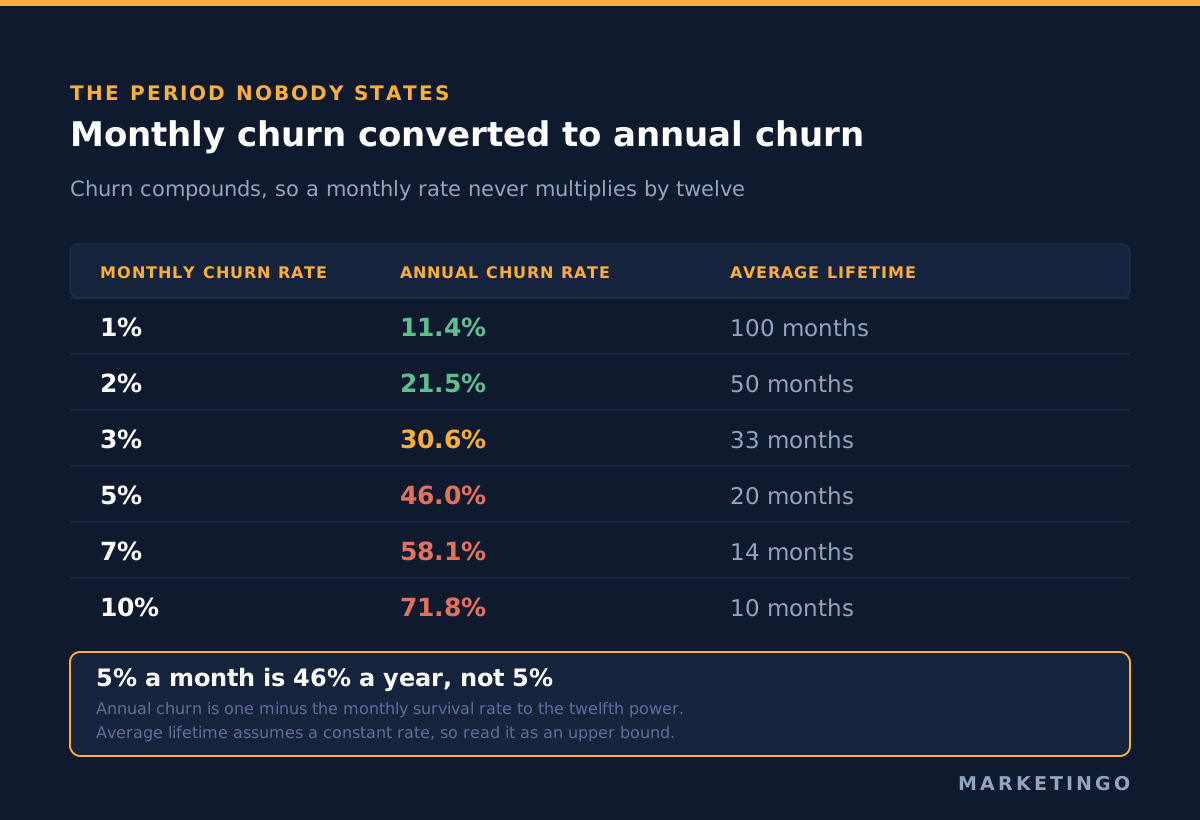
| Monthly churn rate | Annual churn rate | Average customer lifetime |
|---|---|---|
| 1% | 11.4% | 100 months |
| 2% | 21.5% | 50 months |
| 3% | 30.6% | 33 months |
| 5% | 46.0% | 20 months |
| 7% | 58.1% | 14 months |
| 10% | 71.8% | 10 months |
Annual churn here is one minus the monthly survival rate raised to the twelfth power. Average customer lifetime is the reciprocal of the monthly rate, which is the simple version: it assumes a constant churn rate, and real churn is front-loaded, so treat the lifetime column as an upper bound rather than a forecast.
Run the conversion the other way and the benchmark figures in the next section change character completely. A 3.22% annual churn rate is 0.27% a month. A 4.99% annual rate is 0.43% a month. Any monthly churn rate above about 1% is, on an annual basis, a different business from the ones in the published tables.
The four numbers people call churn
Four distinct measurements travel under the same word, and they answer different questions.
Customer churn, also called logo churn or customer attrition. The customer churn rate is the count of customers who left over the count you started with. It tells you how many relationships you lost and says nothing about what they were worth. Finance teams sometimes call the same figure the customer attrition rate; it is the same arithmetic.
Revenue churn. The recurring revenue that left, over the recurring revenue you started with. Gross revenue churn counts only the losses. Net revenue churn subtracts the expansion revenue from customers who upgraded, which is why it can go below zero. A business that loses 3% of its monthly recurring revenue to cancellations and gains 5% from upgrades has negative net revenue churn, usually discussed from the other direction as net revenue retention above 100%.
Voluntary churn. Customers who decided to leave and acted on it.
Involuntary churn. Customers whose payment failed. An expired card, a declined transaction, a bank that blocked a recurring charge. They did not choose to leave and many of them do not know they have.
Customer churn and revenue churn diverge whenever your customers are not all worth the same, which is always. Lose ten customers paying $20 a month and one paying $4,000, and your customer churn looks like eleven problems while your revenue churn is almost entirely one. Report both or you will optimise for the wrong one.
What a good churn rate is in 2026
The honest answer is that no single figure is quotable, and the reason is visible in the data rather than a hedge.
Start with the voluntary and involuntary split, because it is the most actionable number in the category. Across all industries in Recurly's network, using July 2026 data, average voluntary churn is 2.34% and median involuntary churn is 1.25%. Roughly a third of all subscription churn in that dataset is a failed payment rather than a decision. No amount of ad spend, creative testing or audience work touches that third. It is a billing and dunning problem, and it is usually owned by nobody.
Churn also falls as price rises, which is the opposite of what most people assume. Recurly's median annual churn by average revenue per customer, same July 2026 data:
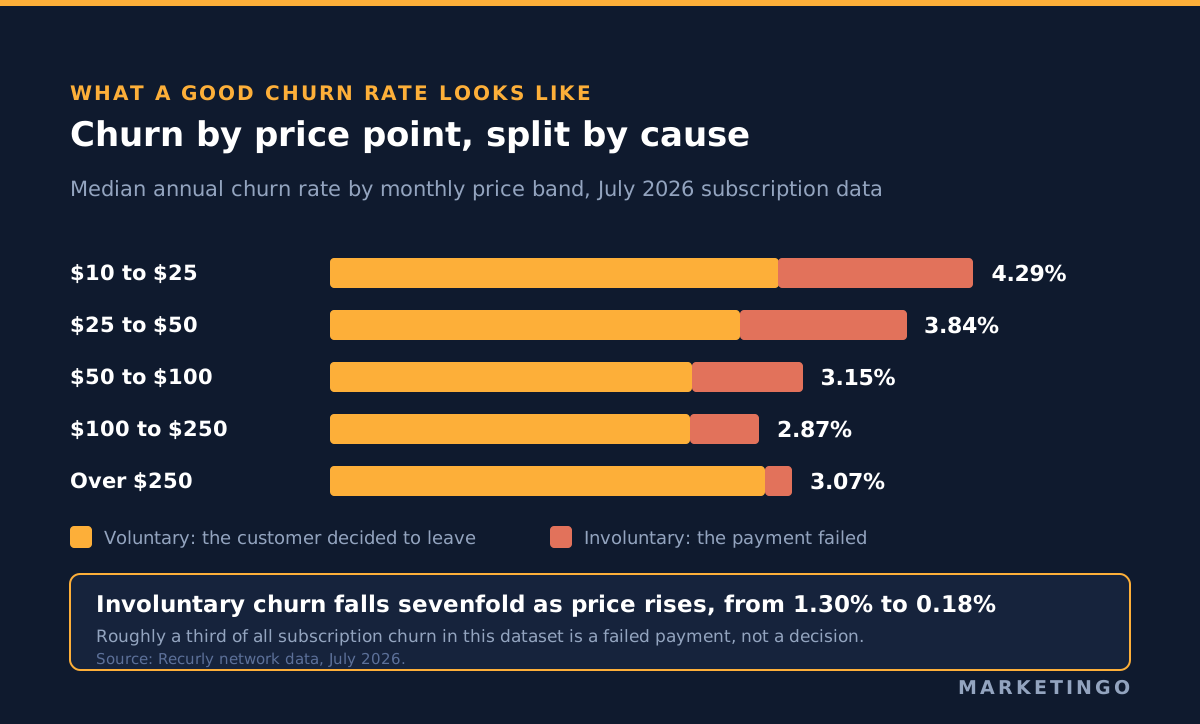
| Monthly price band | Median annual churn rate | Voluntary | Involuntary |
|---|---|---|---|
| $10 to $25 | 4.29% | 2.99% | 1.30% |
| $25 to $50 | 3.84% | 2.73% | 1.11% |
| $50 to $100 | 3.15% | 2.41% | 0.74% |
| $100 to $250 | 2.87% | 2.40% | 0.46% |
| Over $250 | 3.07% | 2.90% | 0.18% |
Involuntary churn drops sevenfold from the cheapest band to the dearest, from 1.30% to 0.18%. Cheap subscriptions are bought on cards that expire, by customers who do not notice the decline email. If your churn benchmark comparison ignores price point, it is comparing two different businesses.
The by-industry version of these figures, which runs from 3.22% a year for software as a service up to 4.99% for education, sits in our piece on customer retention rate, along with the internal inconsistencies in that dataset. We have not repeated the table here, because churn and retention are the same measurement in two directions and one page should own it.
Why the two most cited datasets disagree by a factor of four
Recurly puts median annual churn for software as a service at 3.22%. ChartMogul's SaaS Retention Report, published November 2023 on 2022 data from over 2,100 software businesses, puts top-quartile annual customer retention at 85.7% for accounts paying over $500 a month, which is 14.3% annual customer churn. For roughly comparable price bands, Recurly's over-$250 tier shows 3.07% annual churn against ChartMogul's 14.3% for the top quartile, and the top quartile should be the better half.
Both numbers are real. They measure different populations. Recurly counts subscriptions on a payments network, where one company can hold thousands of small recurring plans and a cancellation is a single subscription ending. ChartMogul counts accounts in a subscription analytics tool used heavily by business-to-business software companies, where one account is a company and losing it is losing a contract. A consumer subscription box and a $600-a-month software seat are both one row, and they do not behave alike.
The practical consequence: a published churn benchmark is only usable if you can tell what one unit in the denominator was. When you cannot, the number is decoration.
The 5% churn rate claim, and what the data says
"A good churn rate is 5%" is the most repeated statement in this category, and it is quoted without a period attached often enough that the same figure now does two incompatible jobs.
As a monthly figure, 5% is widely presented as acceptable. Baremetrics states that a typical good churn rate for software companies selling to small businesses is 3% to 5% monthly, that an enterprise product should sit below 1% monthly, and that early-stage companies often see 10% to 15% in the first year. Those are offered as rules of thumb, with no dataset, sample size or date attached.
As an annual figure, 5% is close to the worst industry in the largest dated public dataset available. Education sits at 4.99% a year in Recurly's July 2026 data, and software as a service at 3.22%.
So the same number is simultaneously a target and a warning, depending on a word that usually goes unsaid. Worse, the two readings are not close. Convert the rule of thumb and 5% monthly churn is 46% a year, which is nine times the figure that would be a poor annual result. A software business losing 3% to 5% of its customers every month is losing between a third and a half of its customer base annually, and in the dataset most often cited to reassure it, the median company loses about 3% in the same twelve months.
The resolution is not that one source is lying. The rule-of-thumb range describes early-stage, self-serve, low-price products, which is also the population Recurly shows churning hardest. The published annual medians describe established subscription businesses across a payments network. Neither is a benchmark for the other, and quoting either as "the average churn rate" without the period, the population and the date is how a board gets told that 4% monthly churn is fine.
Our position: stop using an external churn benchmark as a target. Use it once, to check whether your number is in a plausible range for your price point, then compare your churn to your own last four quarters by cohort and acquisition channel. That comparison is the only one where the denominators match.
What churn does to the most you can pay for a customer
Churn is the metric that decides your acquisition budget, and almost nobody running the ad account sees it.
The chain is short. Churn sets the average customer lifetime. Lifetime multiplied by monthly revenue and gross margin gives lifetime gross profit. Divide that by your target ratio of lifetime value to acquisition cost and you have the most you can pay to acquire a customer.
Take a product at $100 a month with a 60% gross margin and a target lifetime value to customer acquisition cost ratio of 3 to 1.
| Monthly churn rate | Average lifetime | Lifetime gross profit | Maximum CAC at 3:1 |
|---|---|---|---|
| 2% | 50 months | $3,000 | $1,000 |
| 5% | 20 months | $1,200 | $400 |
| 10% | 10 months | $600 | $200 |
Moving churn from 2% to 10% a month cuts what you can afford to pay for a customer by 80%, with no change to the product, the price or the ad account. This is why a media buyer asked to hit a $300 cost per acquisition on a business churning at 10% a month is being asked to do something the arithmetic does not allow.
These are undiscounted figures and they assume churn stays constant, which it does not. The discounted version, the three methods for getting there and the reason the simple multiplication flatters you are in our piece on customer lifetime value. The ratio itself, and why it decays as you scale, is covered in LTV to CAC ratio. If you would rather not forecast a lifetime at all, CAC payback period answers the same question in months of gross profit and needs no assumption about how long customers stay.
Google Ads has already encoded a churn definition, and it is 540 days
Value-based bidding turns churn into a live input to the auction, and the platform has made the definitional choice for you.
Google Ads customer lifecycle goals let you tell the system to treat new and existing customers differently. Google describes the customer acquisition setting as one that "helps you to prioritize bidding that can reach and acquire new customers", and offers two modes: New Customer Value, which bids "higher for new customers than existing ones", and New Customer Only, which bids exclusively for them. Google recommends "New Customer Value for all advertisers with purchase conversion goals" (About customer lifecycle goals).
The detail worth knowing is in how a new customer gets identified. Under Google's auto-detection, a customer counts as new if "they haven't made a purchase within the last 540 days" (Measure your lifecycle goals campaigns). Eighteen months of silence and the system treats a lapsed customer as a fresh acquisition, and bids the acquisition premium to win them back.
For a business with a 12-month purchase cycle that window is generous to the point of being wrong, and it will quietly pay a new-customer premium for repeat buyers. For a monthly subscription it barely matters. Either way the window is a churn definition, and if yours differs from Google's you should upload your own customer lists rather than leave it on auto-detection. The same documentation describes the retention side, where you "can upload lists of these lapsed customers and assign a higher bid value for them using Customer Match".
Google also reports cost per acquisition inside these goals as "the ad spend allocated to new customers divided by the total of unique new customers acquired through a campaign", which is a narrower figure than the blended acquisition cost your finance team uses. Two numbers with the same name again.
Involuntary churn is where this gets expensive. Every failed payment that ends a subscription shortens the measured lifetime, which lowers the value you feed into value-based bidding, which lowers your bids, which shrinks the account. A dunning problem in the billing system becomes a budget cut in the ad account, routed through a lifetime value calculation nobody audits.
The common causes of customer churn, and which ones paid media can touch
Reducing churn is mostly not a media problem, and pretending otherwise wastes everyone's quarter. The honest division of labour:
Owned by billing, not marketing. Failed payments, expired cards, dunning sequences that give up after one attempt, no card-update prompt in the account. This is the third of all churn in the Recurly data and it is the cheapest to fix.
Owned by product and onboarding. Customers who never reached the point where the product does its job. This shows up as a first-90-day cliff in cohort data and it is invisible in a blended monthly churn rate.
Owned by customer success. Unused seats, a champion who left, a renewal nobody prepared for.
Owned by paid media, and this is the short list. Three levers, and they all work at the front of the funnel rather than the back.
First, who you acquire. Broad prospecting audiences and discount-led offers bring in customers who churn faster, and that cost lands months later in a lifetime value calculation rather than in this week's cost per acquisition. Segment churn by acquisition campaign and channel, and you will usually find one source whose customers are worth half the average. Cutting it raises blended lifetime value without touching the product.
Second, what you promise. Landing pages and ad copy that oversell set an expectation the product then misses, and the mismatch is paid for in month two. A landing page test that lifts conversion rate by promising more can raise churn enough to lose money overall, which is why conversion rate is not a safe standalone target.
Third, what the platform optimises toward. If you send a signup event back to the ad platform, bidding will buy more signups, including the ones that cancel. Sending a retained-customer event instead, or a value-adjusted conversion, points the same budget at customers who stay. The mechanics of getting that signal back are in Google Ads conversion tracking, and the choice of which event to send is covered in sales qualified lead.
That is the whole paid media contribution to churn. It is real, it compounds, and it is smaller than most retention decks imply.
How to track churn so the number is actionable
A monthly churn figure on a slide is churn reporting. Churn analysis is the version that tells somebody what to do, and it needs four cuts rather than one.
By cohort, grouped by the month the customer joined. This is the cut that exposes a high churn rate caused by onboarding rather than by the product. If month one loses 15% of a cohort and months two onward lose 2%, the problem is activation and no amount of customer success attention in month six will reach it.
By acquisition channel and campaign. The only cut that tells the ad account anything. Join your churn data back to the source that brought each customer in, and the customers most likely to churn usually cluster in one or two campaigns. That is the finding that lowers blended acquisition cost without touching a bid.
By price band and plan. Churn behaves differently at $19 and at $900, as the benchmark table above shows, so a blended rate across both describes neither.
Voluntary against involuntary, separated at the source. Keep them in different columns permanently. Mixing them means a billing problem shows up as a product problem, and the team monitoring churn spends a quarter rewriting onboarding emails to fix a dunning sequence.
Set the cadence to match the billing cycle, so monthly subscriptions get a monthly read and annual contracts get a quarterly one with renewal dates visible. Give the voluntary column to product and customer success teams, the involuntary column to whoever owns billing, and the channel cut to whoever owns the ad spend. Churn prevention work that is not assigned to a named owner does not happen, and a single blended number assigns it to everyone.
When churn rate is the wrong number to steer on
Churn rate is the wrong primary metric in three situations.
When nothing recurs. A store where customers buy when they need something has no subscription to cancel, so there is nothing to churn out of. A 95.8% annual retention benchmark borrowed from the subscription world means nothing there. The equivalent questions are what share of customers ever buy a second time, how long the gap between first and second order runs, and what the average order value does on the repeat purchase.
When your customers are not all worth the same. Customer churn treats a $20 plan and a $4,000 plan as one unit each. Steer on revenue churn and report customer churn beside it.
When the business is growing fast. A blended monthly churn rate on a customer base that doubled this quarter is dominated by customers who have been around for weeks, and it will drift for reasons that have nothing to do with whether your product keeps people. Cohort retention curves answer that question. A single blended rate does not.
Where to take this next
Churn, lifetime value and acquisition cost are one calculation with three names, and the answer decides what your ad account is allowed to spend. If you want the acquisition half of it in front of you in a few minutes, run your numbers through the lead generation ROI calculator for a business-to-business funnel, or the ecommerce ROAS calculator for a store. Both sit in our resources library with the rest of the metrics that decide profit.
If the gap you have found is on the acquisition side rather than the retention side, that is work we do. MarketinGO runs paid media for business-to-business and high-ticket lead generation and for direct-to-consumer ecommerce, across Google Ads, Meta, LinkedIn and Microsoft Advertising, with senior operators on the account. For software companies specifically, our AI and SaaS work is where churn-aware bidding matters most: in one engagement for an artificial intelligence compliance software company we took demo requests from a standing start to 6 to 10 a month in 60 days, a rise of 66%, on a lean Google and LinkedIn setup with no budget increase.
If you want to know whether your account is buying customers who stay, the fastest way to find out is to have someone look at it. A free ad audit covers the account structure, the conversion signals being sent back to the platforms and the segments your spend is actually buying.